It will be another week or so before refined data is available for me to update my market dashboard, but using MLS data and focusing only on sales of existing homes provides a good look at how we finished 2022, and how last year compared among the last five yesrs.
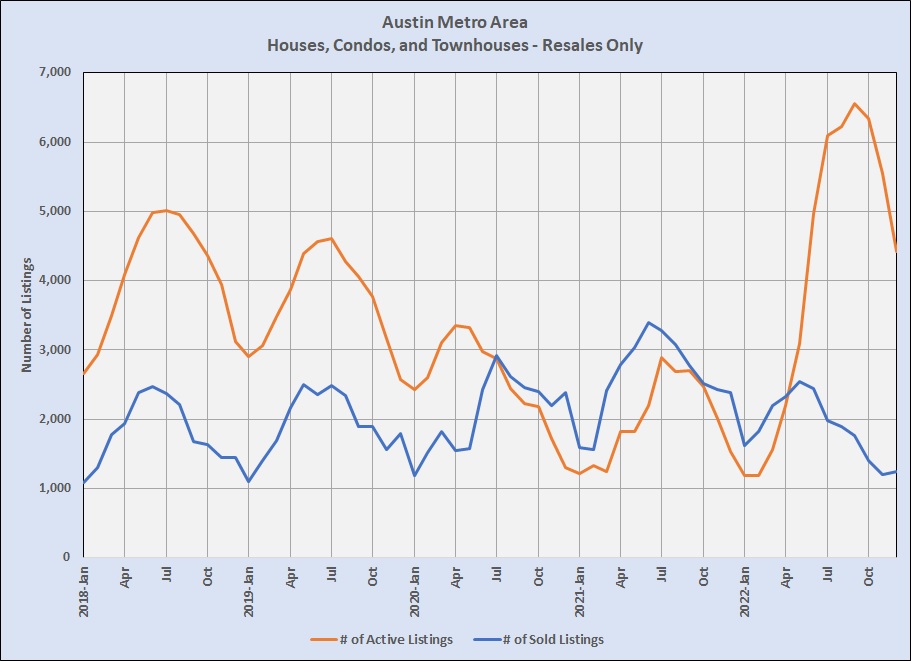
First, as I have told you for many months, listing inventory soared after the 1st quarter of 2022, as unit sales slowed:
That shift led to dramatic changes in the supply of homes for sale versus demand, i.e., Months’ Supply:
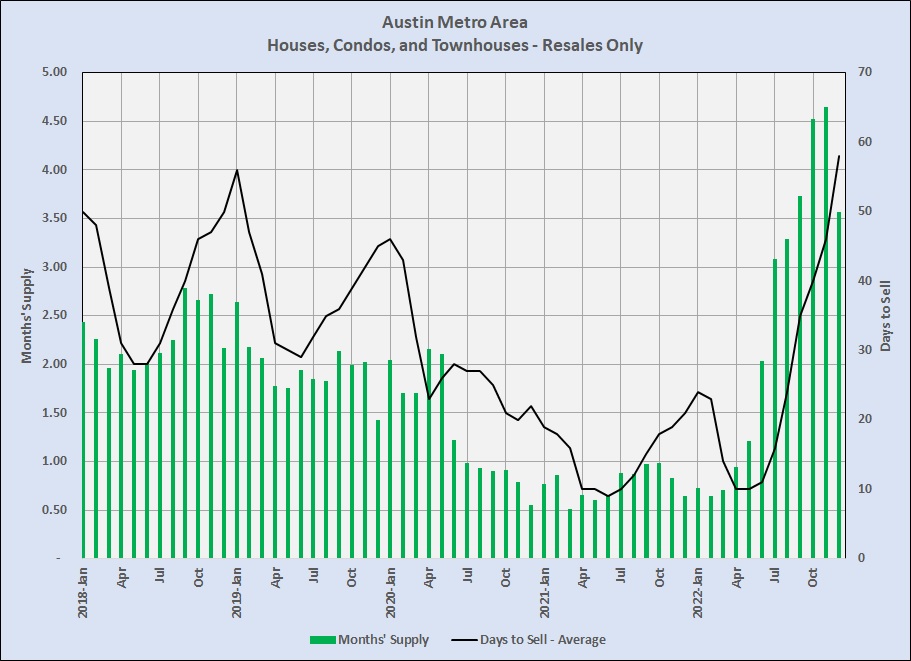
The supply of homes for sale actually began to creep up in March and April, but inventory still represented less than one month’s absorption at that point. In May 2022, listing inventory was above one month for the first time since June 2020. As listing inventory grew the pace of sales slowed, with Days to Sell increasing from 10 days in April to 58 days in December. That slow-down resulted in part from the quality of homes that didn’t sell before the shift, and in part because of overpriced homes listed before sellers adjusted to the market transition.
Note, too, that the Fed started raisng the Federal Funds Rate in March, modestly at first and more aggessively as the months passed, convincing some on-the-fence home buyers that mortgage rates were about to rise and leading them to buy before they might have planned. The average rate for a 30-year fixed-rate loan topped 5% in April and approached 6% in June. By September, that rate was above 6% and it remains there now. Those changes squeezed some buyers out of the market, impacting the decline in unit sales and growth in Days to Sell. (For more on this see Mortgage interest rates and the Fed.)
With the shift in supply and demand we saw a sustained decline in month-to-month sale prices for the first time in years. Still, though, prices remained higher year-over-year through most of the year:

The dotted lines on the chart above make it easy to compare end-of-year 2022 prices to prices earlier in the 5-year period. Buyers who closed during 2022 may well have lost market value during the year, but most homeowners in our market still have substantial equity in their properties based on years of strong appreciation. (Five years ago this month, the median sale price of a home in our metro area was $279,000. In December 2022, the median price was up 61% to $450,000!
Yes, we have seen monthly price decreases in recent months, but in December we had 3.5 months of listing inventory. Historically, a 6-month supply was considered “balanced,” with neither buyers nor sellers having a built-in advantage in negotiations. By that measure, we are still in a seller’s market, with employment and population growth continuing to drive demand for housing. With supply chain issues and unpredictable labor availability, builders of new homes are working hard to help but resale inventory remains critical. 2023 will continue as a year of transition, but expecting strong demand again this year is entirely reasonable.
I will update my market dashboard soon, but I hope this brief historical review is useful. Market watchers still project great things for the Austin-area economy and real estate market. I’ll keep you informed here.

Discussion
No comments yet.