Bill Morris on Austin Real Estate
Latest Post
National Housing Market: Price Drop Insights
Following up on Texas Housing Performance and Trends, an article about the larger — national — market environment appeared a few days ago at Realtor.com:
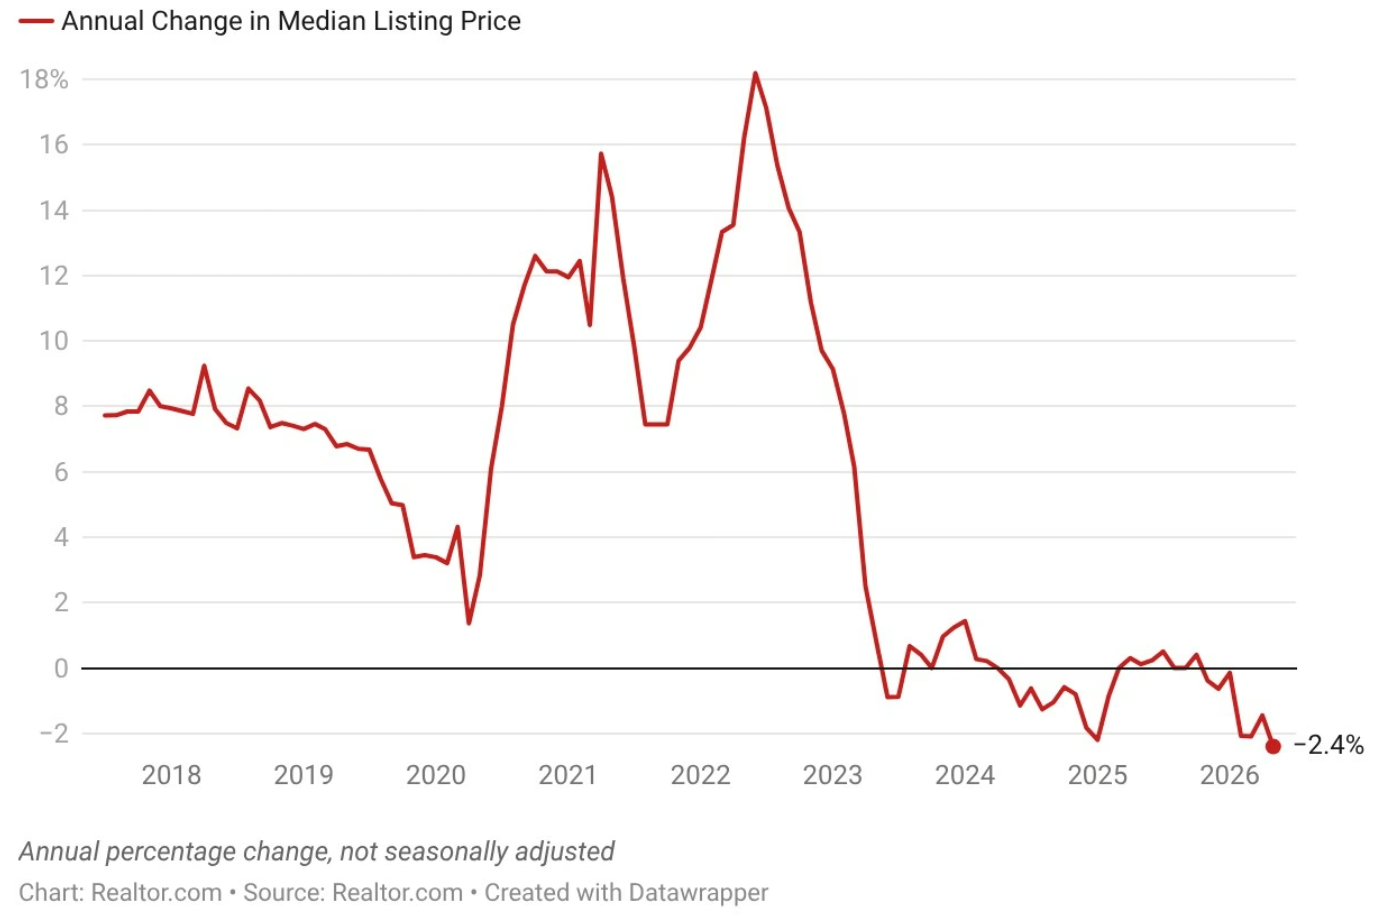
Home Listing Prices Post Sharpest Drop in 9 Years as Sellers Face Reality Check
That aarticle reports: “The national median listing price has been falling for seven consecutive months, and in May it plunged 2.4% year over year to $429,500, representing the sharpest annual decline in Realtor.com® data going back to 2017, according to the latest monthly housing market trends report.”
Obviously, that year-over-year decline in list prices is not good news for home sellers, but for perspective compare those recent months to the extreme volatility experienced in 2021 and 2023.
Realtor.com also noted that “May also saw the median price per square foot, measuring a home’s value relative to size, shed 2.5% from a year ago—a downward trend reflected in 35 of the 50 largest markets.”
” ‘Those two trends are not a contradiction,” explains Realtor.com® senior economist Jake Krimmel. “Sellers are pricing to sell rather than pricing to test the market. Buyers, despite rates remaining higher than expected, are still showing up when prices are within budget.’ ”
The comments above set the stage for a lot of valuable information in that article, such as AUSTIN being among the U.S, metros with the largest year-over-year price declines. Near the end of the article you’ll find a tool that allows you to enter your city or zip code to see where your area lies on the Market Clock that was introduced a few months ago.
For more similar information about the Austin-area market, you’ll find Stagnant market continues to be valuable. Feel free to visit BillMorrisRealtor.com and CentralTexasHomeSearch.com for a lot more.
