In Yes, we are in a different market environment I wrote about the transition we have seen in the Austin-area residential market, focusing on unit sales and inventories, and on the pace of market activity and the change from bidding wars — from above-list price sales — to closing prices farther below list prices than we have seen in more than a decade.
My market dashboard provides a more complete view (discussed after the charts):
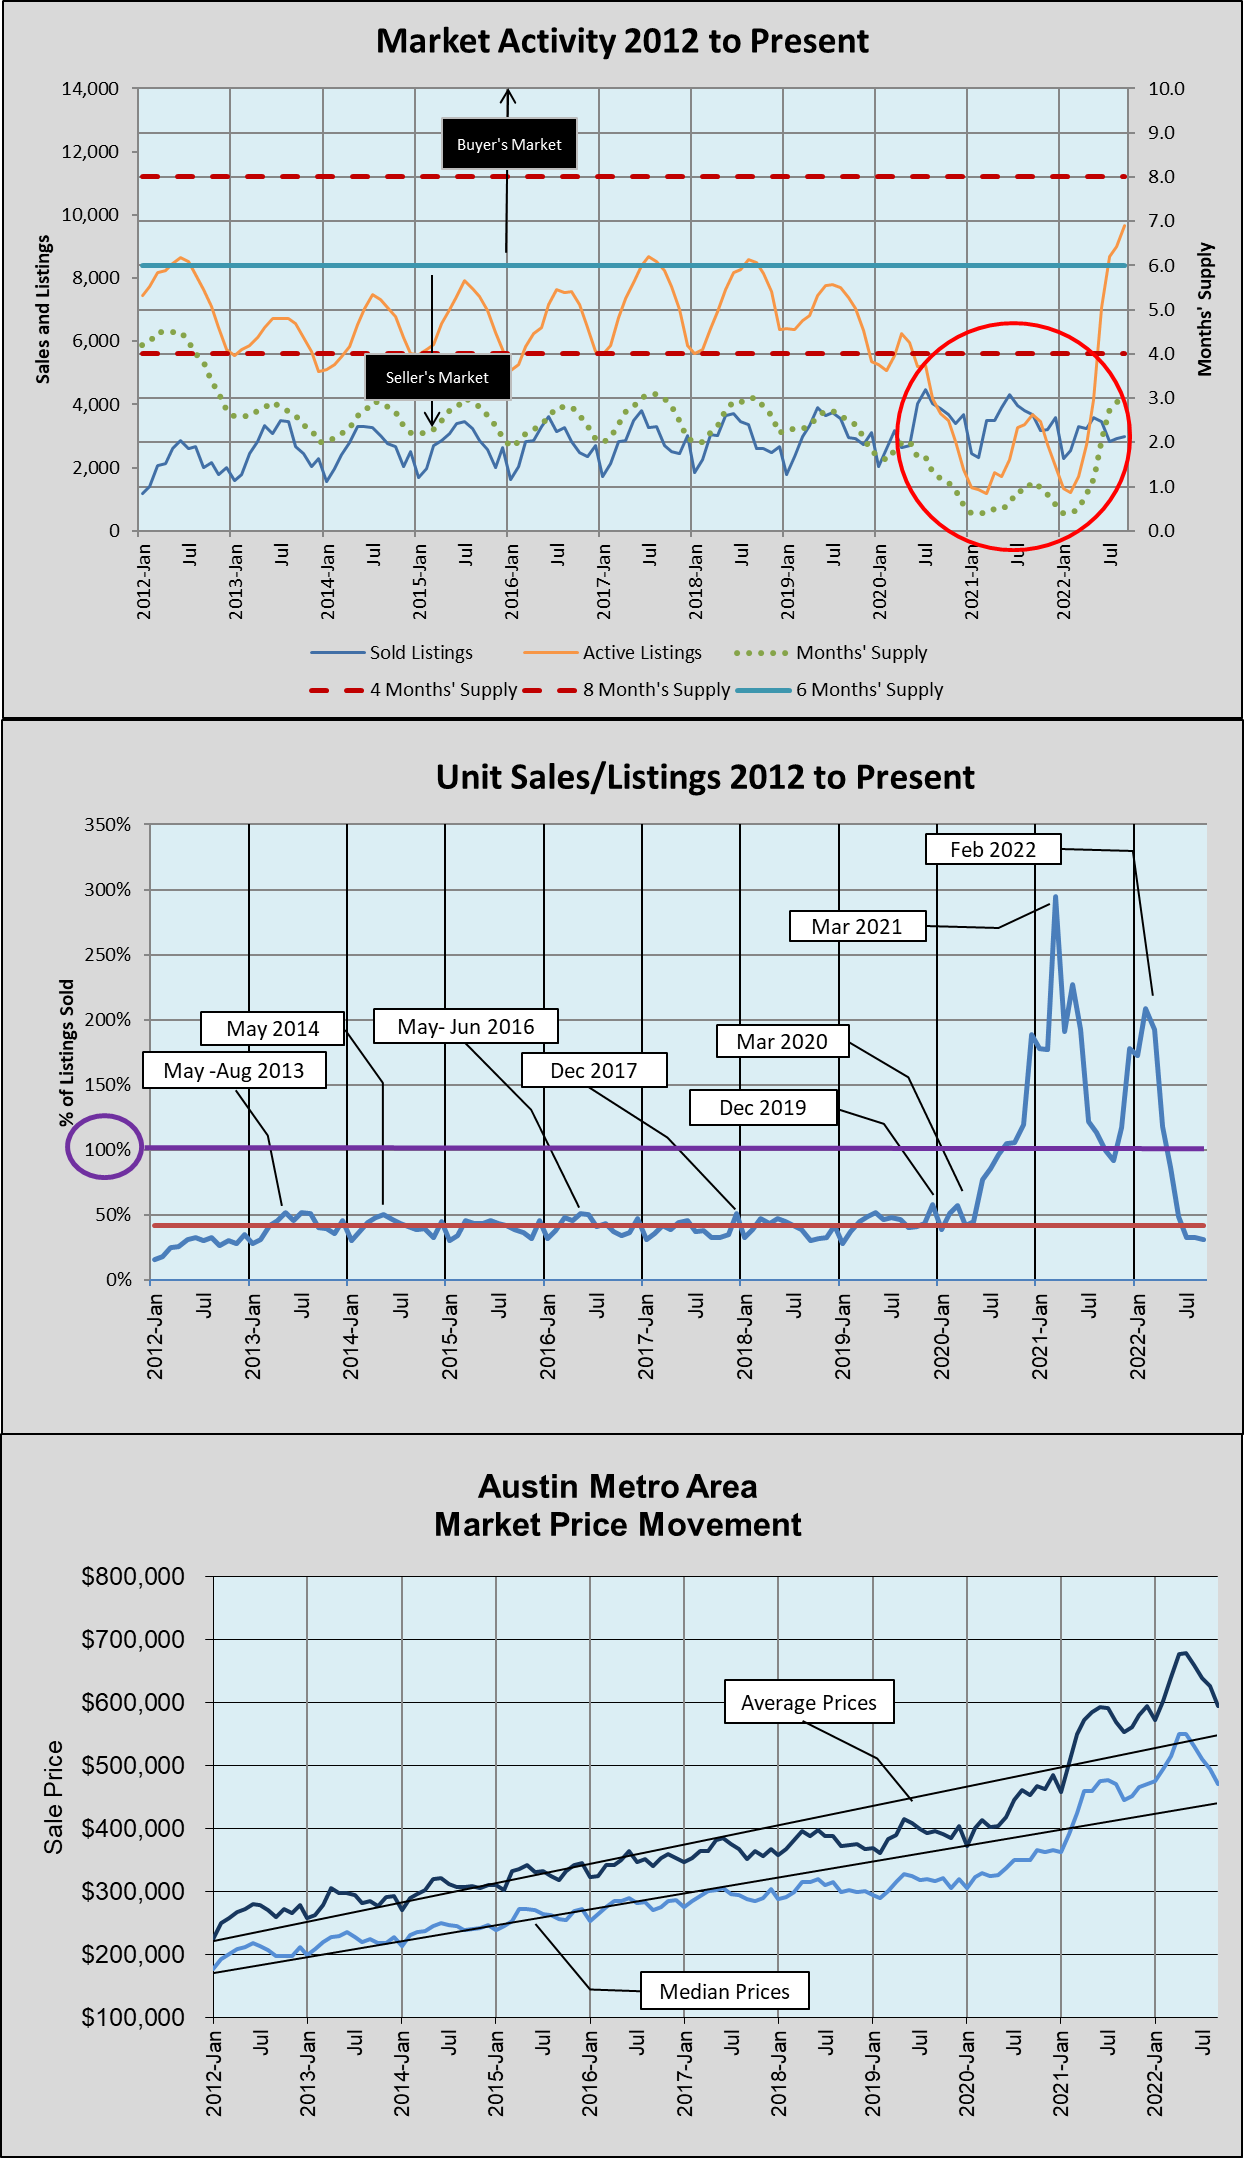
In the top chart I circled an unprecedented situation we experienced during the Covid era: From September 2020 through April 2022 we sold more homes each month than we listed (with a very brief interruption in October 2021).
The orange line on that chart shows the extreme shortage of inventory for sale — a bottom of just over 1,200 active listings in February 2022 versus peaks of 8,767 in July 2017 and 8,599 in August 2018. In the seven months since that low point we accumulated listings, reaching 9,761 in September 2022. That is the most active listings we’ve had since May 2011!
In the same chart the green dotted line shows Months’ Supply. That metric showed that inventories would last 1 month or less for almost every month from November 2020 through April 2022, growing to 3.1 months’ supply by September 2022.
NOTE: That level of supply is about the same as annual peaks of all other years of this market cycle except for the two years discussed here. Another important comparison: Before this market cycle we considered 6 months’ supply “normal” so even with this new peak, housing demand in our area is high enough that we are about halfway back to a “balanced” market.
In the second chart you can see the effect those market dynamics had on our absorption rate in 2021 and 2022. The ratio of unit sales to listings reached 294% in March 2021 and 209% in February 2022! Now that ratio has returned to the level we held from 2013 through the first half of 2020. (The average of this metric from 1990 through 2012 was 22%. The average since 2013 has been 63%. The average from September 2021 through April 2022 was 160%!)
Finally, the bottom chart shows what that supply-demand imbalance did to sale prices across the metropolitan area, with the median price peaking just under $500,000 in 2021 and at $550,000 in 2022. We have now seen four consecutive months of declining prices, but each month this year is still higher than the same month last year. With these monthly decreases, median and average prices are now moving back toward their long-term trend lines.
The election year uncertainties, inflation worries, rising interest rates, international turmoil, and holidays, I don’t expect to see a recovery from this situation this year but ours remains one of the healthiest regional economies among metropolitan areas across the country, and employment and population continue to grow, driving demand for housing. Forecasting at this point is more challenging than ever since the downturn in 2008, but the fundamentals are very different (and better) this time, and I expect to see a return to expansion and modest price growth in 2023. I’ll keep you informed here.

Discussion
Trackbacks/Pingbacks
Pingback: ICYMI – Austin “supernova” forecast | Bill Morris on Austin Real Estate - November 10, 2022