The market transition I have commented on in recent months is still changing the experiences of all participants — home buyers and sellers, real estate brokers and agents, mortgage lenders,, and appraisers. Even the pace at title companies is calmer as sales slow. Below are several charts using MLS data that demonstrate the effects on buyers and sellers.
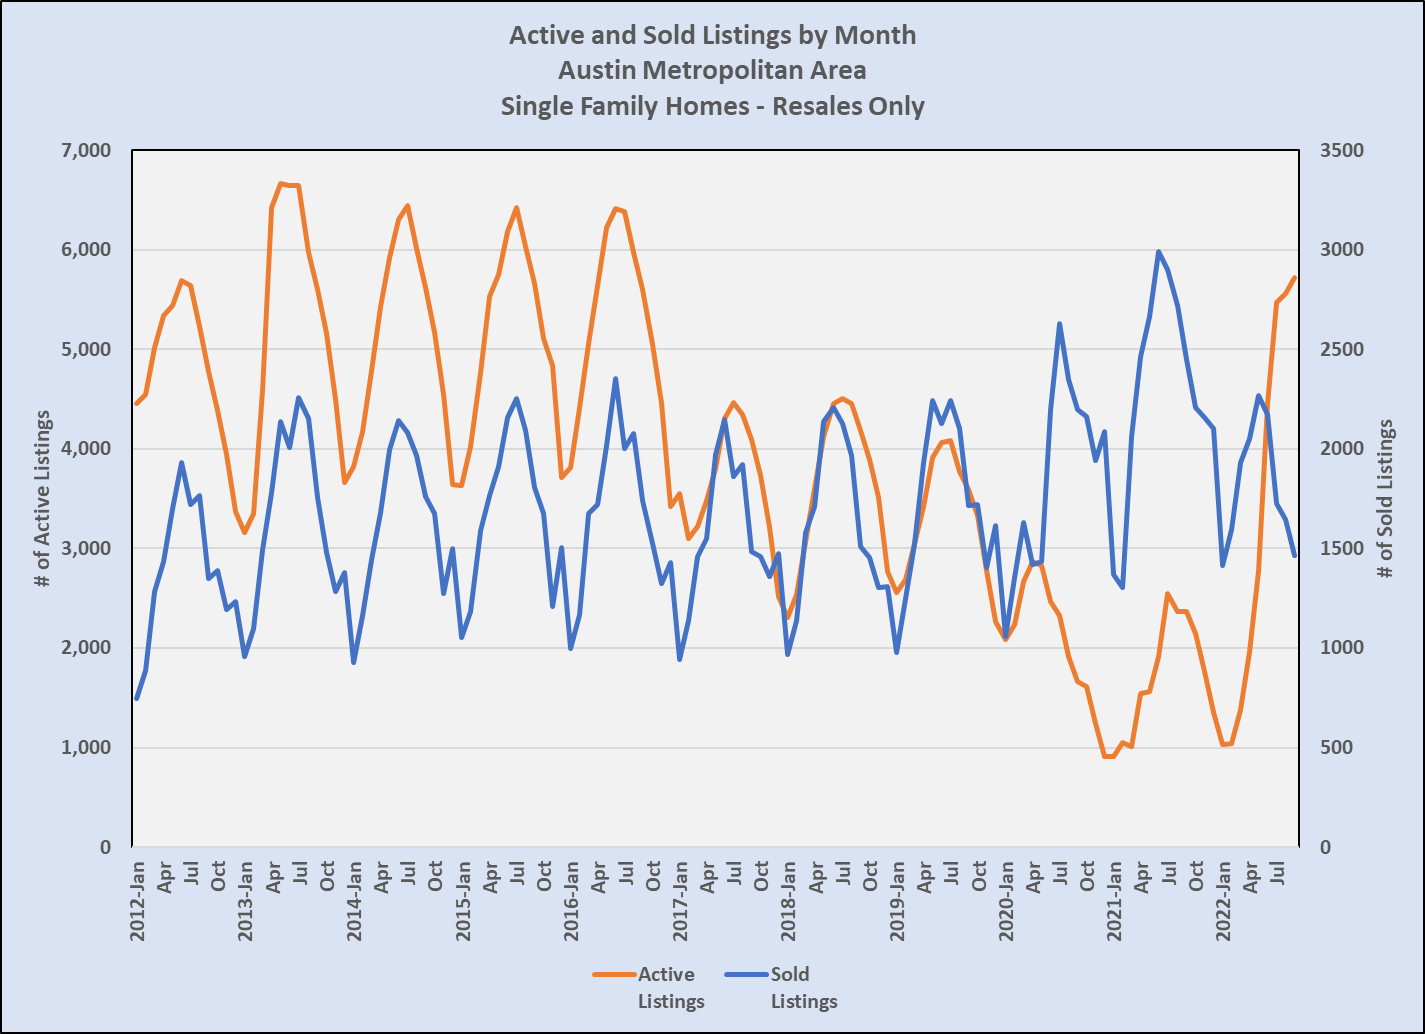
Notice in all three charts that 2020 and 2021 were very different from all the previous years of this very long market cycle. The number of single family homes sold in 2020 was more than any of those years, and 2021 sales were even higher. That extreme demand led to record low listing inventories in both years. (Notice that in the middle of 2021 there was a surge of new listing activity as sellers capitalized on the wild market activity, but even that spike produced the second lowest number of listings in the entire cycle.)
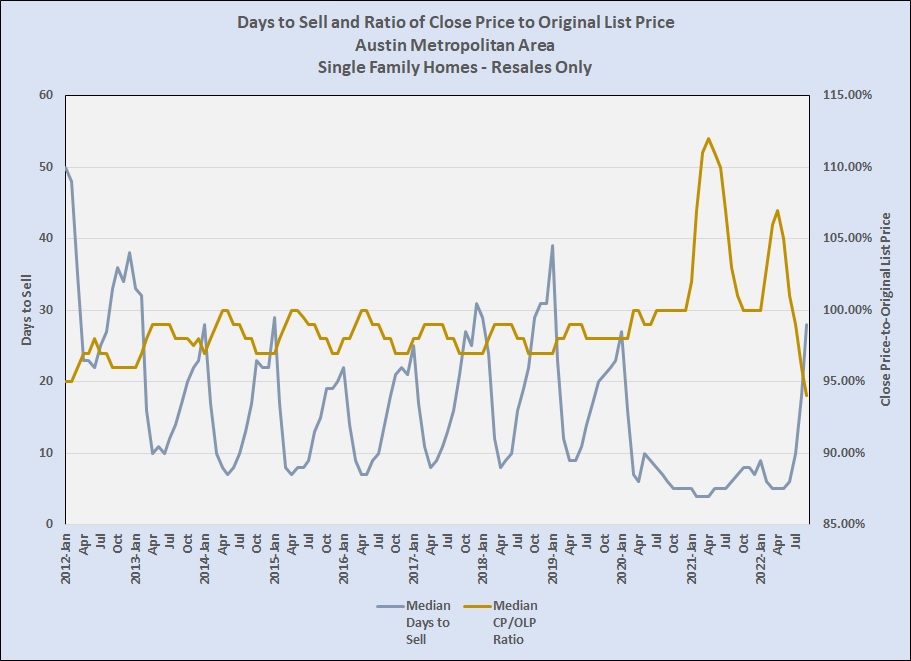
The supply-and-demand imbalance produced market velocity we hadn’t seen before, with Days to Sell falling from 39 days in January 2019 and 27 days in January 2020 to 5 days in January 2021. Sold homes were on the market for a median of 28 days in September of 2022, compared to 7 and 5 days in the two previous years, respectively. That pace in those two years caused bidding wars unlike any we saw in previous market cycles, driving sale prices rapidly upward but an interruption June-October 2021 and the current downturn that began in May 2022:

Those bidding wars pushed the ratio of actual sale prices to peaks of 112% of original list prices in April 2021 and to 107% in 2022. In just a few months, that ratio has now fallen to 94% — where we were in 2010 and 2011.
Against that backdrop, the changes we see in 2022 are significant, and they are changing the landscape in which we all work for now. The number of homes sold this year peaked in May at about the same number we saw in 2019, and listing inventory is now back to the level we last saw about this time in 2016 (top chart).
That dramatic change in market forces, along with mortgage rates that have doubled in just a few months, is changing the dynamics between buyers and sellers. Couple those effects with real uncertainties about the larger U.S. economy and international relations, the policy and political debates leading to mid-term elections, followed closely by the holiday season, and we have a recipe for a confused market.
As I have said all year, I continue to believe in the underlying health of the Austin-area real estate market, and that we will see a better balanced but growing market in 2023. The employment and population growth that drove this boom continue, and mortgage rates remain low relative to most of the past several decades. And keep in mind that even though we have seen month-to-month declines in median prices in recent months, prices are still up year-over-year.
It’s hard to argue that this situation will change or become more predictable this year, but watch here for updates. I will update my more comprehensive Market Dashboard when final data is available from the Texas Real Estate Research Center later this month

Discussion
Trackbacks/Pingbacks
Pingback: ICYMI – Austin “supernova” forecast | Bill Morris on Austin Real Estate - November 10, 2022