It’s no secret that the Austin-area residential real estate market has been crazy-busy for the past five-plus years — supply and demand severely out of balance, multiple offer competition, rapidly rising prices, and frustrated prospective home buyers. I have heard recent comments that things are changing this year. I have “felt” something different in recent weeks myself with some listings competing with nearby new construction, but I trust data so I decided to check on this from 30,000 feet …
Market cycles happen, and this one will too. This “up” market is actually very long in the tooth now, but the usual indicators don’t show a slow-down. With that said, this is the reason I created my Market Dashboard ten or so years ago. Even with great data, though, the only way to know for certain that a market has turned a corner is when you can look back at the change weeks or months in the past. Today’s research looks at a few specific metrics to see what trends are apparent at this point.
As a starting point, here is the history of single family home listings and sales since 2004:
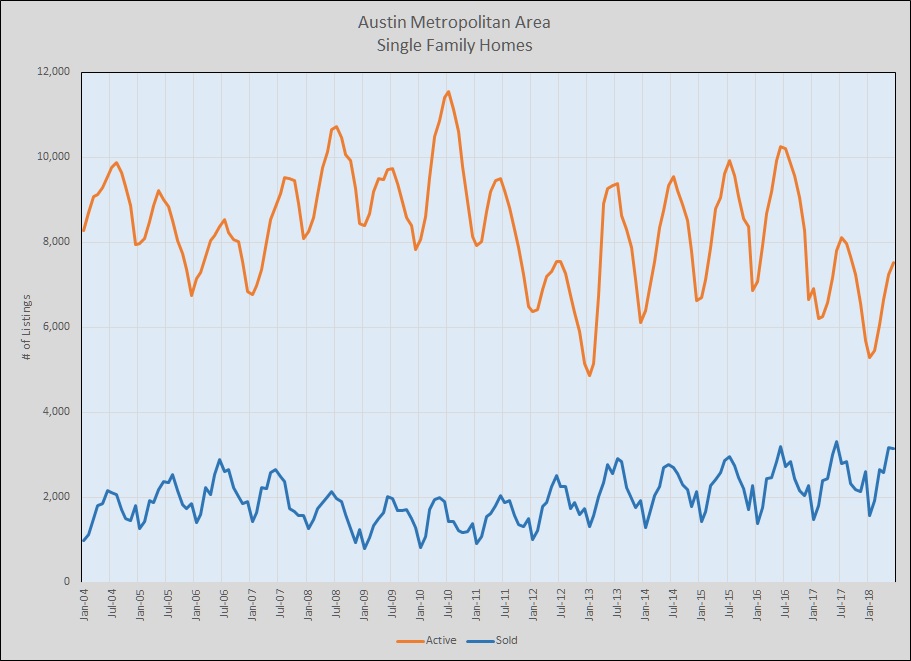
Think back to the over-heated market we saw in 2006 and early 2007, leading up to the mortgage industry meltdown, and you can see that the downturn yielded higher inventory and lower sales volume, as you would expect. You can also see that year-over-year sales began increasing in 2012 and that listing inventory came down, subject to very noticeable seasonal swings. Listing inventory is noticeably lower this year and last than in the previous four years. More on that a little later ….
“Months of supply” is an important measure of market health. Most market economists consider listing inventory of 6 to 6 1/2 months to be “normal” — i.e., a generally balanced market environment. Here is how our supply has looked over the same timeframe as the previous chart:
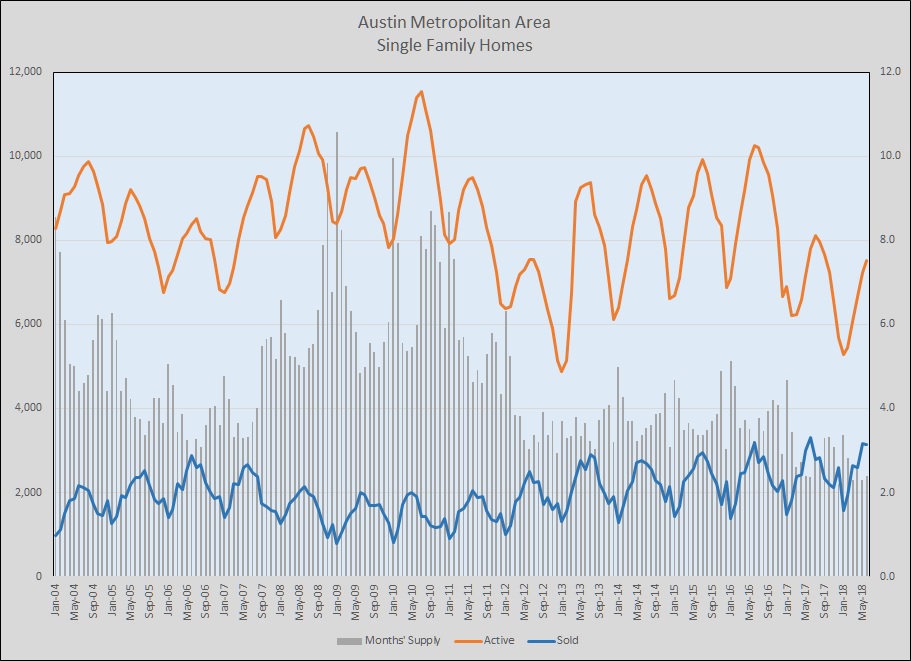
Compare the gray bars to the 6-month level on the right-hand axis and notice that we have generally had 4-months’ supply or less since 2012. Notice also that inventory is even lower now, just over 2 months’ supply.
Sales prices are another important metric, and here is a look at actual closing prices compared to original list prices:
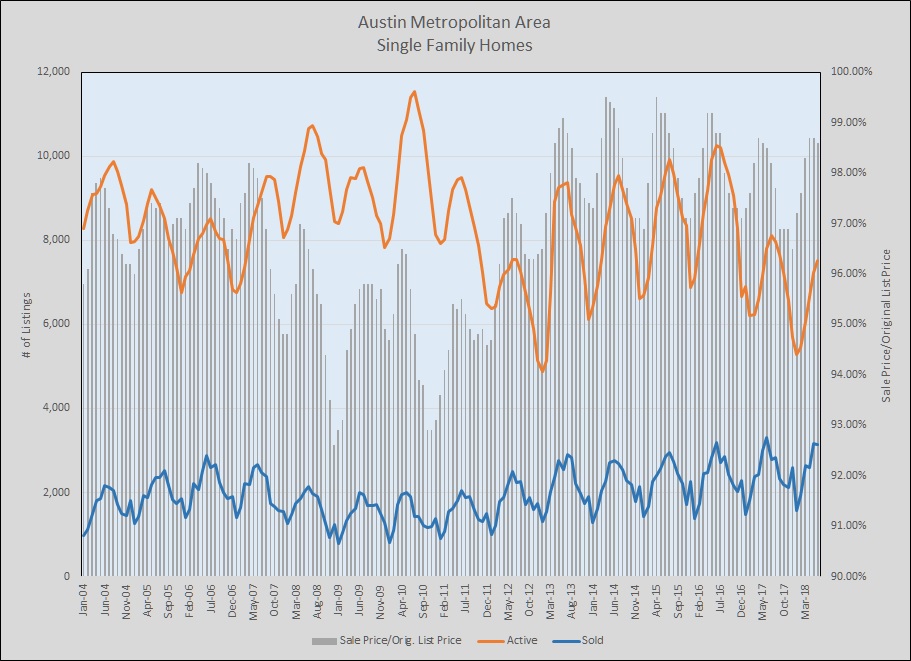
Yes, across the entire five-county metro area, actual sale prices, on average, have been 97% to 99% of original list price for more than five years! As I noted above, at least as of June it appears that listing activity is lower this year than last, and that last year’s listing activity was much lower than the year before. With continuing strong demand, that’s a recipe for increasing prices. In another week or so, the Real Estate Center at Texas A&M University will publish their “final” figures for June 2018, and I will update my market dashboard with that information so I’ll have a more complete picture.
Slower sales — i.e., longer time on the market — is something that agents are very conscious about. Unfortunately, most don’t have visibility of enough listings (as a percentage of thousands of listings at any time) to judge whether it’s a general issue or just one overpriced listing. While some neighborhoods and some market segments are experiencing the change more than others, this overview of Austin metro area activity supports the conclusion that there is a broader change in “days to sell”:
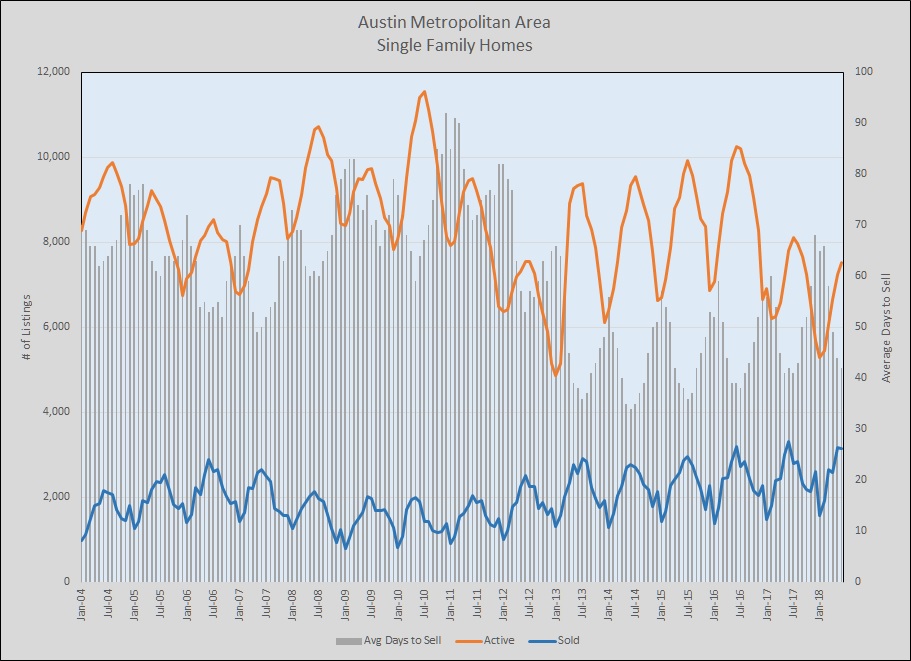
It is worth noting, however, that market velocity is still higher than in 2004, 2005, and 2006, near the last market peak.
So, are we in the midst of market shift? Maybe … but job creation and population growth are still reported to be strong. Moreover, builders of new homes have finally caught up to some degree with our market growth over the past two years, and their unit volumes are not well reported in MLS data. On the other hand, the challenge of being a buyer in this market is itself a constraint on listing activity — a sort of gridlock that causes potential home sellers to just stay put because they don’t know that they can find their next home in time for a coordinated move-out/move-in plan. (Or because they can’t afford the next home they really want after five years of price appreciation.)
When I began this today, I conjectured that rising mortgage interest rates might be causing the market to slow, but I reviewed that carefully and don’t see a correlation yet. If anything, the expectation that rates will rise in the coming months is causing buyers to move more quickly than they might have planned, exaggerating demand at the same time that the creation of new listings slows. If so, that will exacerbate the gridlock that I mentioned earlier.
Slowing down a bit after this long in a boom market wouldn’t really be surprising, but I’m not willing to reach that conclusion based on this data today. I will keep an eye on this and follow up, however. July and August results should be very informative.

Discussion
Trackbacks/Pingbacks
Pingback: Confirmation? | Bill Morris on Austin Real Estate - July 17, 2018
Pingback: Market Dashboard – 1Q 2018 in review | Bill Morris on Austin Real Estate - August 17, 2018
Pingback: Market growth continues | Bill Morris on Austin Real Estate - September 26, 2018