Lake Travis is now about 20 feet below full, and is falling slowly despite periodic rains. I don’t know anyone who believes we’re headed for conditions anything like we experienced in 2011 and 2012, but it’s a fact that climatic conditions have changed for the worse again since 2015:


For details, feel free to visit http://droughtmonitor.unl.edu/CurrentMap/StateDroughtMonitor.aspx?TX. Just the images are enough for this post. The dark red picture of Texas at the left shows that almost the entire state was in Exceptional Drought as of October 4, 2011. The second image, just down and right, shows the state of recovery on June 30, 2015. The third picture shows conditions today. These are essentially a timelapse view of the climatological history of Texas — flood and drought. The state has managed well … and continues to do so … most of the time.
Although the entire state didn’t officially experience a new “drought of record” in 2011, there are certainly observers who believe that that was the worst to ever impact Central Texas.
Economically, Central Texas was severely impacted that year by another event — a very large release of water from the Highland Lakes to support agricultural users near the Texas Gulf coast.
As an active volunteer and Board-member of the Austin Board of REALTORS®, and more recently as a member of the Board of the Central Texas Water Coalition, I have worked on this issue for years. Whether that 2011 release should have happened has been the subject of very considerable discussion and political debate since then. Note that the price LCRA customers in the upper Colorado River basin paid per acre-foot of water was (and still is) more than twenty times the price paid by the downstream agricultural customers ($150.00 vs. $6.50 at that time) — contractually categorized as “firm” and “interruptible” customers, respectively. Assuring that “firm” supply has been a continuing battle.
That said, the purpose of this post is to comment on the economic impact of drought and water management in the upper Colorado River basin and the Highland Lakes. The water release is a prominent feature of this graph — the lake level change in 2011:
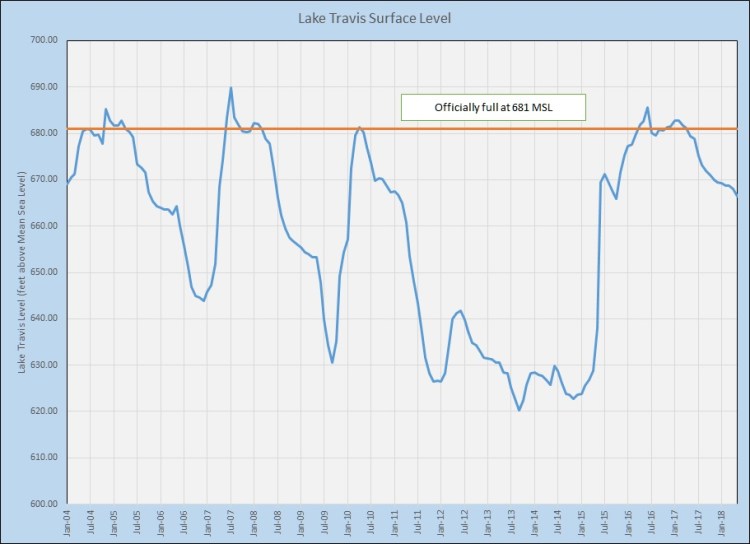
Obviously, Lake Travis has rarely been “full” during that 15-year period, but operating at or above 670 was pretty common until 2011. After the large water release and amid continuing drought, the lake was 50-plus feet below full for most of three years.
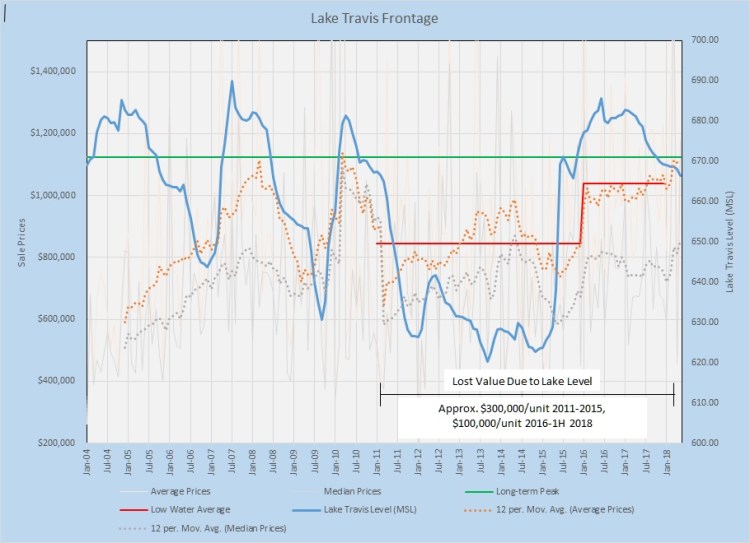
Now, let’s look at what happened to sale prices of single-family homes in the Austin-area during that time:


Yes, the first four of those charts are small, but for now this overview will suffice. The top two charts show average (orange) and median (gray) sale prices in the Austin metropolitan area and in Travis County, and there is no obvious impact of lake levels on prices. The third chart shows prices of homes in the Lake Travis area but without lake views or frontage, and there was little or no pricing effect of the low lake levels. The next chart shows homes with Lake Travis views but without frontage. There was some flattening of sale prices in that market segment, but recovery began very quickly when the water level came back up.
The last chart shows sale prices of homes with Lake Travis frontage, and the relationship between lake levels and home values is obvious. Average sale prices were down about 25% from 2008 and 2010 peaks for virtually all of 2011 through 2015, and remained more than 10% down long after the lake recovered, almost reaching the previous peak by mid-2018 — three years after Lake Travis returned to normal operating levels!
I have not invested time to duplicate that work for properties on Lake Buchanan, but anecdotal evidence suggests the impact was at least as severe there. (For those who don’t know, Inks Lake, Lake LBJ, Lake Marble Falls, Lake Austin, and Lady Bird Lake are managed to maintain more constant levels, using Lake Buchanan and Lake Travis for storage.)
The impact on the net proceeds to home sellers during those years is obvious. Consider a larger view, though. All Texas real property is appraised annually for the purpose of assessing property taxes. Those appraisals are intended to represent actual market values as of January 1 of each year.
Consider the loss of 25% of tax revenues on all lakefront homes on Lake Buchanan and Lake Travis for at least three years, and 10% for another two years. Consider the city and county governments, school districts, and other taxing jurisdictions that depend on those revenues to operate and provide services. Populations and school enrollments did not decline during those years. Neither did the need for services.
In addition to the loss of property values compared to previous peaks, these properties failed to enjoy the broad value appreciation seen throughout Central Texas, so the combination of lost and never-realized tax revenues was even larger. For the Economic Impact section of the 2016 Region K water plan, CTWC estimated this combined effect to be a loss of $2 billion to $3 billion in taxable property values across the region. Obviously, that loss has continued to mount. Moreover, low lake levels significantly impacted tourism and recreational uses of the lakes and the jobs and business incomes from those sources for many years.
I am not writing to discourage sales and purchases of lake-area homes. The Highland Lakes are a beautiful part of our great state, and there is real value in being part of our lakeside communities and in owning property there, and in the long run property values will undoubtedly continue to grow. My purpose is to point out that water is a precious resource in many ways, and that managing that resource for the long term is vital. The City of Austin has prepared a 100-year water plan that has not yet been reviewed and approved by City Council. The sixteen regional water planning groups in the state work to keep 50-year water plans up to date and to keep up with changing demands and developing techniques and technologies. All of this work is extremely important, and I hope this article has highlighted the impacts that one ill-timed water management decision created. We can and must do better!

Discussion
No comments yet.