In March 2011, the average residential sale price in the Austin metropolitan area was $245,100. That was 1.3% higher than the previous month, and 5.5% higher than March 2010. As I have noted in previous posts, the increase in average sale price in recent months has been influenced by a larger percentage of total sales taking place in higher price ranges than before. Homebuyer tax credits over the past three years influenced sales most of lower priced homes, so after the expiration of the last tax credit program we saw less of those properties in the mix, leaving more expensive homes more strongly represented. Now, almost a year beyond the last tax incentives that migration has slowed. (You can see this data and much more at AustinMarketDashboard.com, which I update each month.)
As an updated snapshot of that market influence I reviewed sales of single family homes in March, and also studied how well homes sold in various price ranges as measured by Days On Market and the % of List Price (and % of Original List Price) actually achieved. Separately, I will post information about supply and demand by price range, but I find these other measures interesting as well.
First, it worth noting that the majority — 57% — of of those recent sales were still between $100,000 and $250,000. The “sweet spot” in the Austin market has edged upward in the past couple of years, but it has not made a step-function shift:
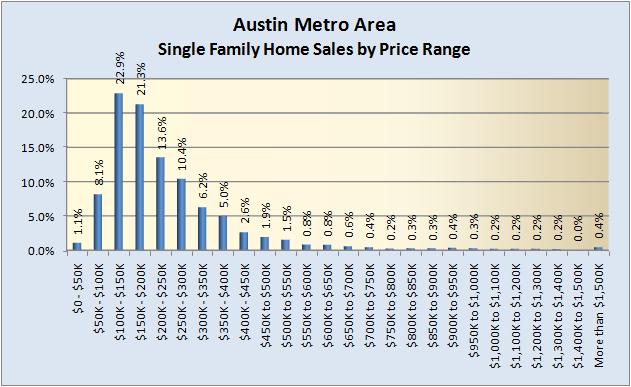
It is also worth pointing out that almost 7% of all sales were above $500,000. That was about equal to sales in that range overall in 2010, 17% morre than in 2009, and twice the contribution of those price ranges ten years ago in 2001.
The common perception has been that sales are VERY slow in those upper price ranges. Actual data from March 2011 bears that out:
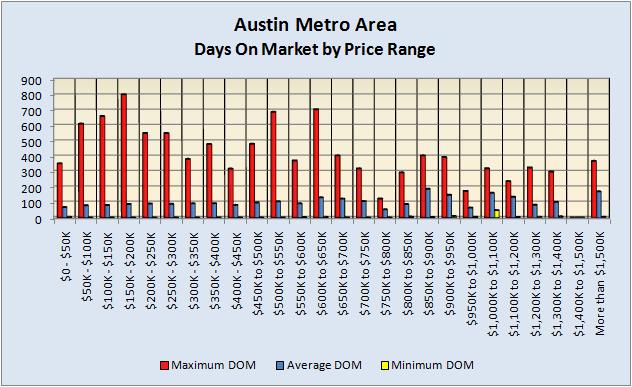
The ten price ranges in which the Average DOM was highest were all above $500,000. On the other hand the two price ranges with the lowest Average DOM were $750,000 to $800,000 and $950,000 to $1,000,000. Clearly, time on market is not determined solely by price range.
What’s the difference? Perceived value vs. price. In all price ranges. All the time. What the homeowner has “in” the property has little to do with what they may take “out” of it at a given point of time. Market value is nothing more or less than what a willing seller and a willing buyer agree on. The proof that all these buyers and sellers in March believed they got the best the market would allow in these transactions is that they signed contracts and traded property for dollars.
One way to view that factor is looking at what percentage of asking price was actually paid by the ultimate buyers. The final price vs. value comparison by those buyers was based on the list price at that time, but total time on market is strongly influenced by the original list price, and by how long it took for that price to reach something near actual market value. Here’s a look at that information:

The average selling price in the lowest priced segment was just over $38,000, so a 1% change in the price was worth about $380. At $1 million, a 1% change was worth $10,000. That means the average difference between sale price and original list price in the low priced segment was about $8,500. The average total price reduction in the higher priced segment was more than $170,000!
It’s easy to discuss percentages, but when you’re a seller who remembers what you paid for the house, and every penny you spent updating and upgrading it, and may even know what your neighbor got for the house next door in 2007, $170,000 is a lot of money!
I have posted statistical evidence in the past that a house priced correctly at the outset will sell faster and for a higher price than the same house that is priced too high at the beginning. (See Pricing to sell — the real world, 02/07/2011.) Real estate professionals owe our clients — buyers and sellers — thorough market analysis and pricing consultation. Obviously, this post offers no advice to any individual homeowner, but even without discussing specific prices of specific homes, I hope this snapshot of one month’s sales will provide a point of reference in thinking about positioning the home you wish to sell.

This is a really great blog. Thx to the auther
Posted by Evelyn | May 21, 2011, 5:24 PM