I see and hear media reports about a coming crash in the housing market — all from non-real estate media. That’s not because outlets that are related to our industry are trying to put a happy face on bad news. It’s because there’s simply no reason to expect such a crash based on actual market performance and underlying data.
As a starting point, this historical context is important:
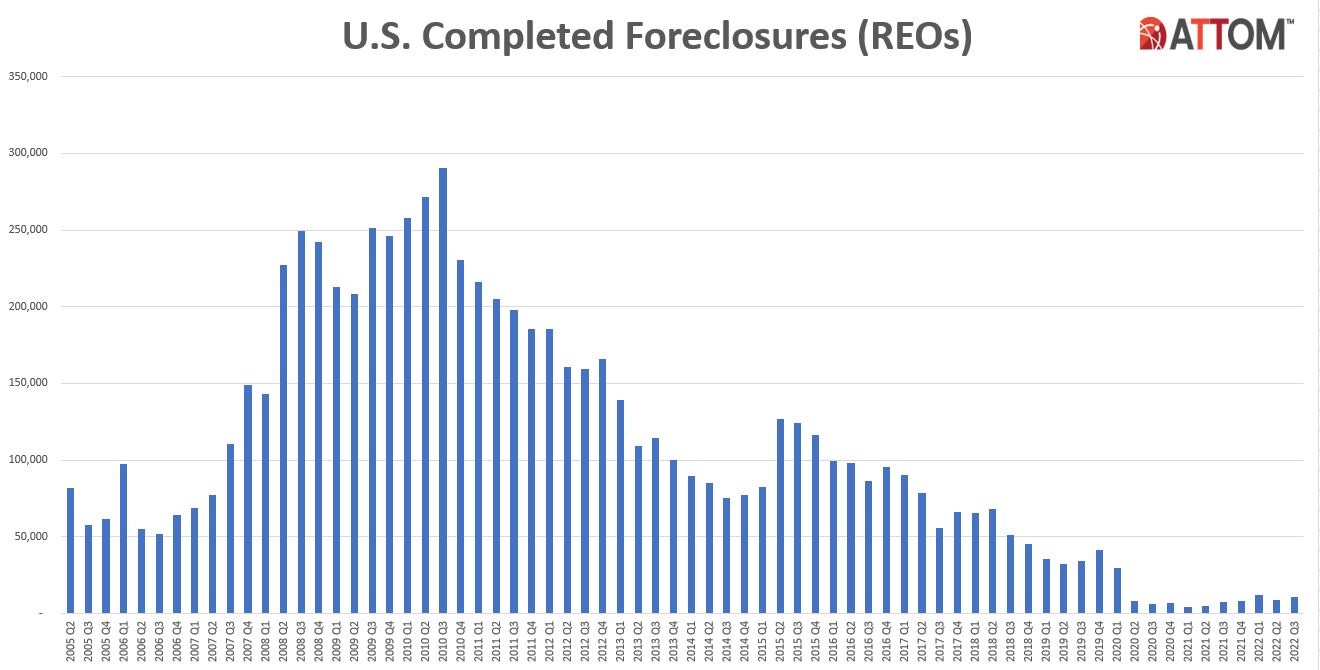
The axes are not readable at that size, but the labels at the bottom go from 2Q 2005 at the left to 3Q 2022 at the right. The Y-axis goes from 0 to 350,000 in 50,000 unit increments. The peak of foreclosure activity was 3Q 2010, with just under 300,000 completed foreclosures. The number declined steadily to about 80,000 in 3Q 2014, then climbed to about 125,000 in Q2 2015, with the current market cycle at full pre-pandemic speed.
With rapidly increasing home values, owners’ home equity also soared, meaning that there was no need for most owners to lose their homes to mortgage lenders. The vast majority could sell at break-even or at a profit if their financial situations made continued ownership unaffordable.
The pandemic era began in early 2020, and in 1Q 2020 there were about 30,000 foreclosures nationwide. Then began the period with very small numbers of foreclosures per quarter. Housing markets around the country were in transition for much of 2022, and I have written much about what that looked like in the Austin area. Home prices peaked last year and mortgage interest rates doubled, and as a result the number of sales has declined and we have seen month-to-month declining prices as well. This is not a repeat of what we experienced in 2008 – 2010, though. Buyers are coming back into the market so far this year and housing inventories are still far below “normal” levels so upward price pressure will continue. Concerns about inflation and a broad recession are real, but most economists expect a mild recession, if any.
The housing market in the Austin metropolitan area also includes miniscule impact from mortgage foreclosures. The chart below shows monthly activity from 2013 through January 2023 — all Active Listings and Unit Sales (blue and green lines) and the number of those that were owned at the time by lenders or trustees (black and red lines):
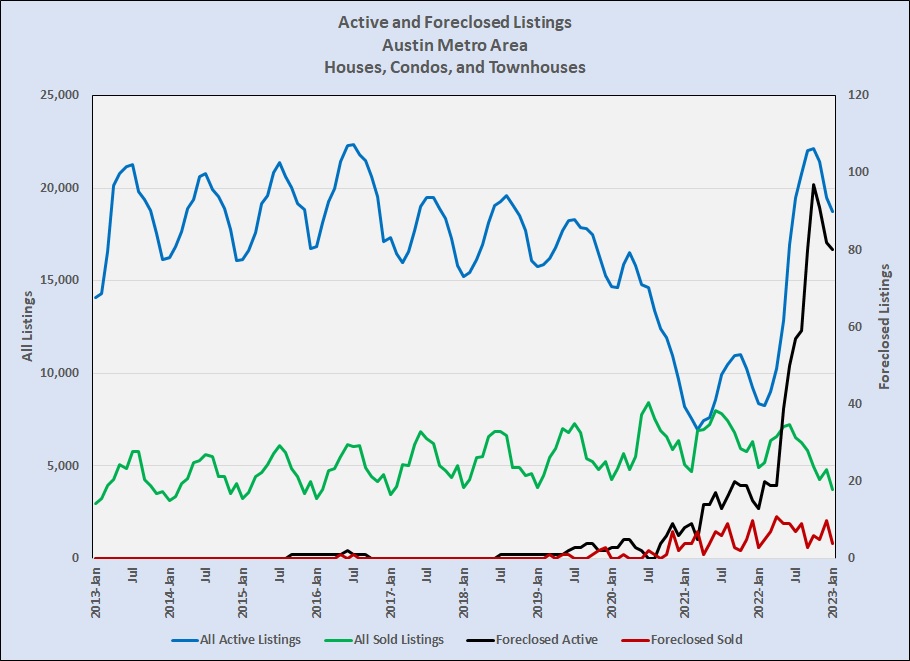
For most of this market cycle — 2013 through mid-2020 — there were no or very few foreclosures. There were more in the second half of 2020, but the peak that year was 9 foreclosed homes on the market in November out of almost 11,000 active listings. 2021 saw some fluctuations, and as the current market transition began listing inventory across the metro area soared from about 8,300 active listings in February to 22,000 in October. At the same time, the number of foreclosed homes on the market shot up from 20 to 97 –from 0.2% to 0.4% of total listings, respectively. In December 2022, 10 of the 4,830 homes sold were foreclosures — 2/10 of 1%.
As I pointed out in 2022 in perspective, some homeowners who purchased in 2021 and 2022 might have lost home equity, and if they must sell now might do so at a loss. Again, though, after the previous eight years, total home equity in our regional market is very substantial, and the threat of a foreclosure flood is unrealistic. I do expect 2023 to remain variable and unpredictable, but the future of home values in our area is still positive.

Discussion
No comments yet.