2022 is in the books now, and I have written recently about where we stood at the end of the year and how 2022 compared to the previous five years. (See Market Dashboard and 2022 in perspective.) Now it’s time for my annual look back at home prices across our 5-county metropolitan area.
I’ll touch on some high points after sharing this chart:
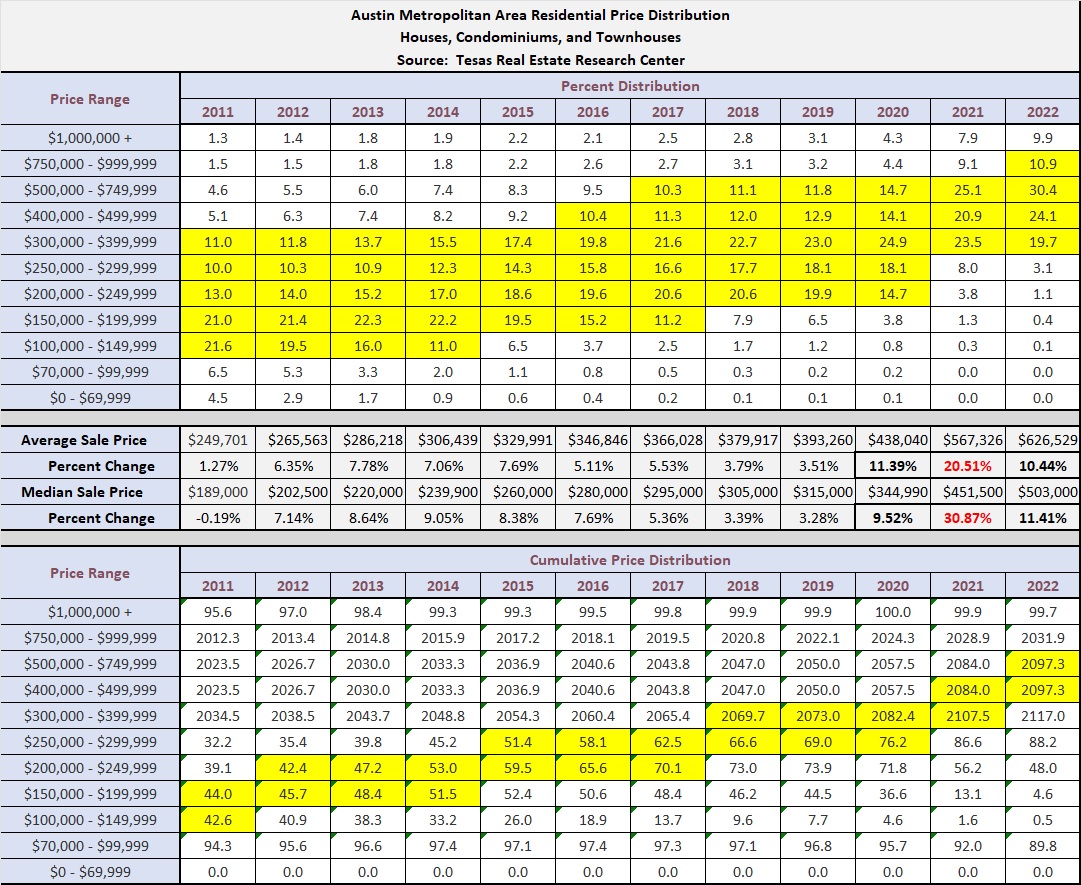
The top part of the chart summarizes the percentage share of total sales by price range in each year since 2011. I have highlighted the price ranges that represented 10% or more of the market each year. 2012 was the year our metro market climbed from the bottom of the last market cycle, and in 2013-2014 the same ranges remained well represented. In 2015 and later you can see the most prevalent prices ranges move upward, with the $750,000 to $999,999 range taking more than 10% of all sales for the first time in 2022. The under-$300,000 range represented less than 5% of all sales last year, down from 38% just two years earlier! (As recently as 2014, 14% of all sales were under $150,000!)
The bottom section of the chart shows the cumulative percentage of sales moving upward through the price ranges, and I have highlighted the ranges that included the median sale price in each year. Again, price growth over the years is clear. To put that in perspective, in 2012-2014 you could have seen half of all homes sold by shopping under $250,000. By 2022 seeing half of all sold homes would have required shopping above $500,000. The median price of a home in our metro more than doubled during this one (very long) market cycle!
The four rows in the middle of the chart show the average and median sale prices each year, along with the year-over-year increases in those prices. Note the extreme magnitude of price increases in 2020 through 2022, and especially notice 2021. In 2021, at the height of our supply-and-demand imbalance, the average sale price increased by 21%, and the median price grew by 31%!
For comparison, the average of year-over-year changes in median price from 1990 through 2019 — 30 years and multiple market cycles — was 5.3%. From 2020 through 2022, the average change was 17.6%! As you think about that pace of annualized change, keep in mind that half of 2022 saw negative price movement — month-to-month price declines.
We are seeing tentative signs of life in the market again in 2023, with continuing inventory shortages, mortgage interest rates much higher that pre-2022, and concerns about where prices are really headed this year. As I have said many times, our local/regional economy remains strong, demand to live and work in the Austin area remains high, and housing supplies remain strained. We are still in a technical sellers’ market. It doesn’t feel that way to many sellers at this point, but optimism about the future is well-founded. The transition we’re going through now will be sporadic and somewhat unpredictable this year, though. I’ll keep you informed here as we see that trend develop.

Discussion
Trackbacks/Pingbacks
Pingback: Update: Austin home price distribution | Bill Morris on Austin Real Estate - July 6, 2023