In Housing supply remains strained I promised an update of my market dashboard when final data for March became available from the Texas Real Estate Research Center. Now’s the time:
This chart includes 2012 (the year the Austin area emerged from the Great Recession) and all of the current very-long market boom cycle (so far …):
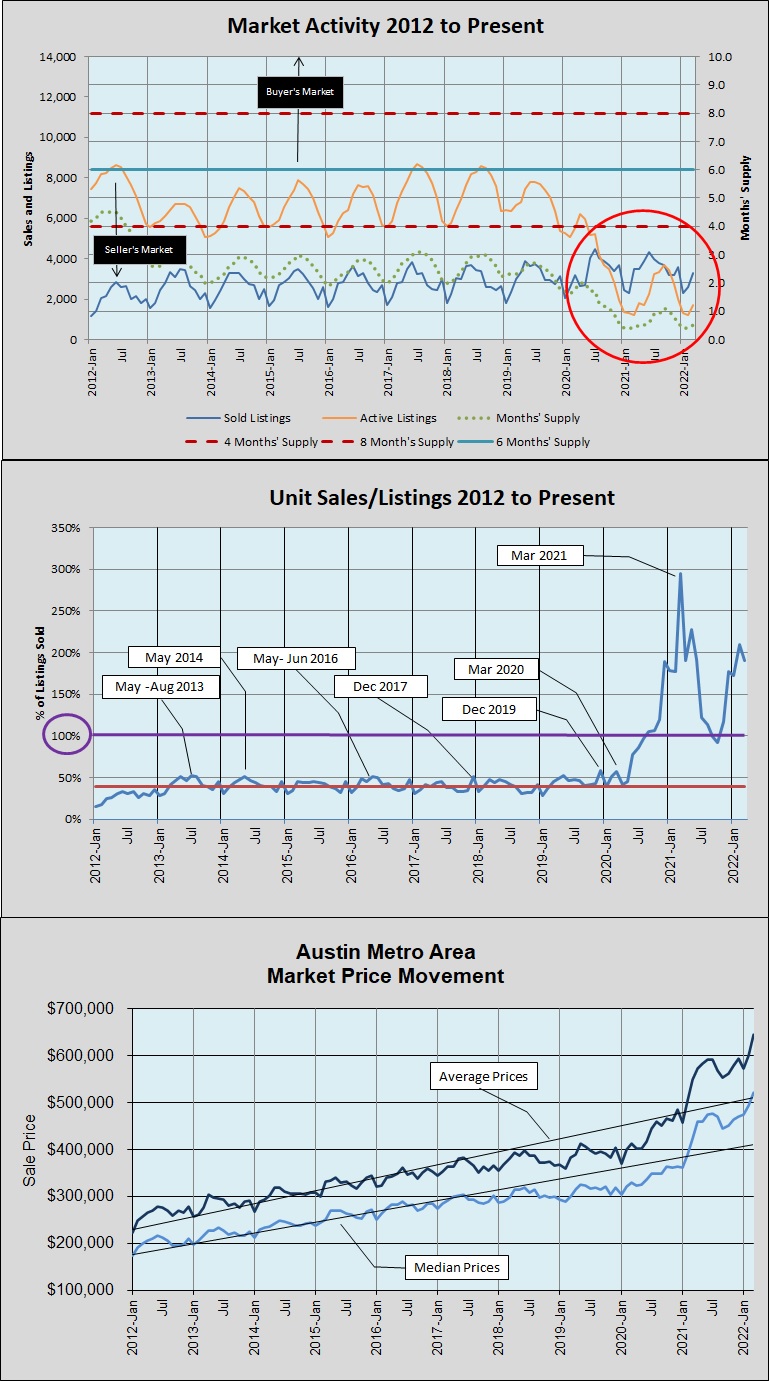
During 2011 listing inventory peaked in May with 7 months’ supply, but unit sales didn’t reach pre-recession levels until 2013. In the top graph above you can see that we have now spent 9 1/4 years with inventory at or below 3 months’ supply — half of what we used to consider “normal” or “balanced” conditions — and two of those years, March 2020 through March 2022 were much lower. The circled area in that chart shows that in 17 of the past 19 months the number of homes sold was greater than the number listed. Inventory averaged just 3 weeks’ supply since November 2020, and just 2 weeks’ supply so far in 2022!
The middle graph above highlights the period when sales exceeded listings. Notice that from January 2013 through May 2020 the ratio of unit sales to listings overed very near the average of 39%. Then, that ratio soared in June, July, and August, going above 100% for the first time in September 2020. It peaked at 294% in March 2021 and has stayed above 100% since then, with the brief dip in September and October of last year.
The bottom graph shows the impact of that situation on average and median sale prices across the 5-county metropolitan area. The median sale price across the metro area was $521,000 in March 2022, and the average price was just over $645,000. Both were record highs, and the first-ever area-wide median above $500,000 is a real milestone!
The limited availability of homes has hindered sales over the past several months, but the constraint on unit sales has not slowed price growth:
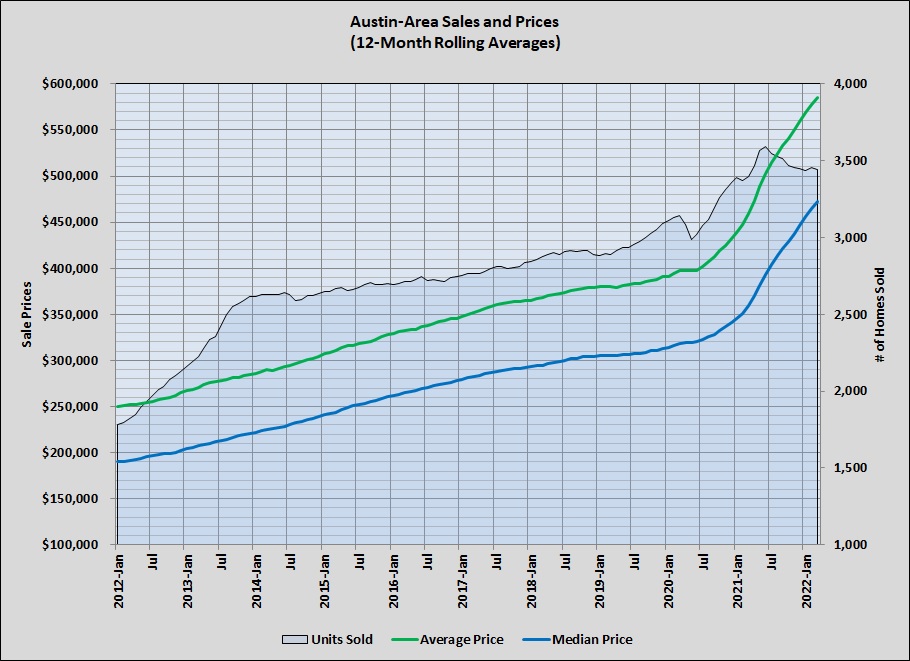
As I have said many times, there isn’t any obvious reason for our market environment to change because the demand is driven by strong growth in employment and population, especially in high-paying job categories.
My next post will provide an annual update on the price distribution of all homes sold in our region in 2021. You won’t be surprised to see that more expensive homes now comprise a larger share of sales than in any previous year.

Discussion
No comments yet.