If you follow me here, you saw an earlier version of this chart in January:
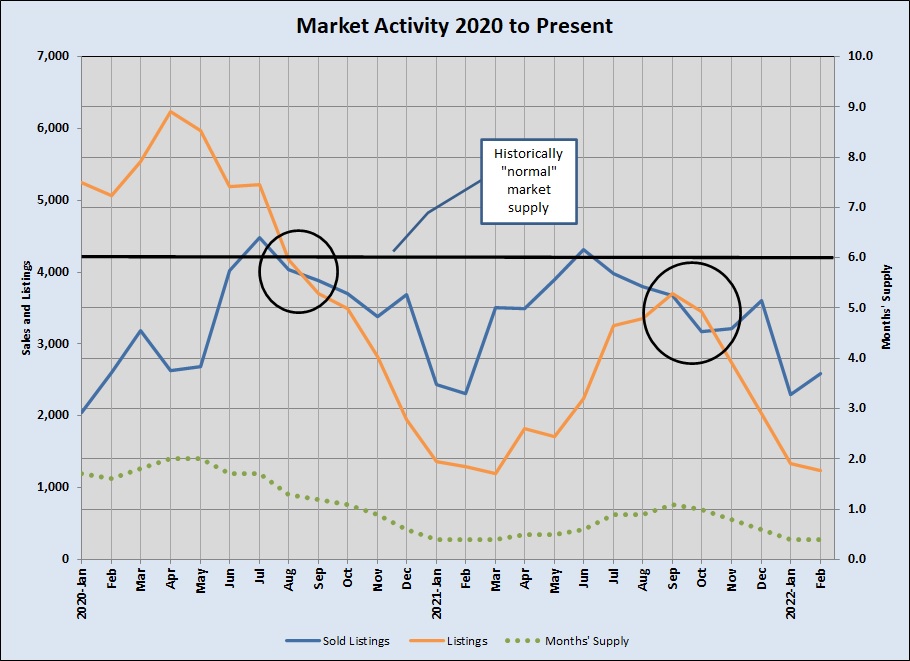
As I pointed out previously, September 2020 was a significant turning point in a much longer supply-vs.-demand challenge. That was when we sold more homes than we listed, and with a brief interruption a year later, we have been consuming listing inventory since then — 17 of the past 18 months! The result is that our Months’ Supply metric has been at or below 1 month for 14 of the past 16 months, averaging 0.7 since September 2020, and only 0.4 months so far in 2022. That’s just 12 days’ inventory at the current pace of sales, compared to 6 months that we used to consider “normal” or “balanced.”
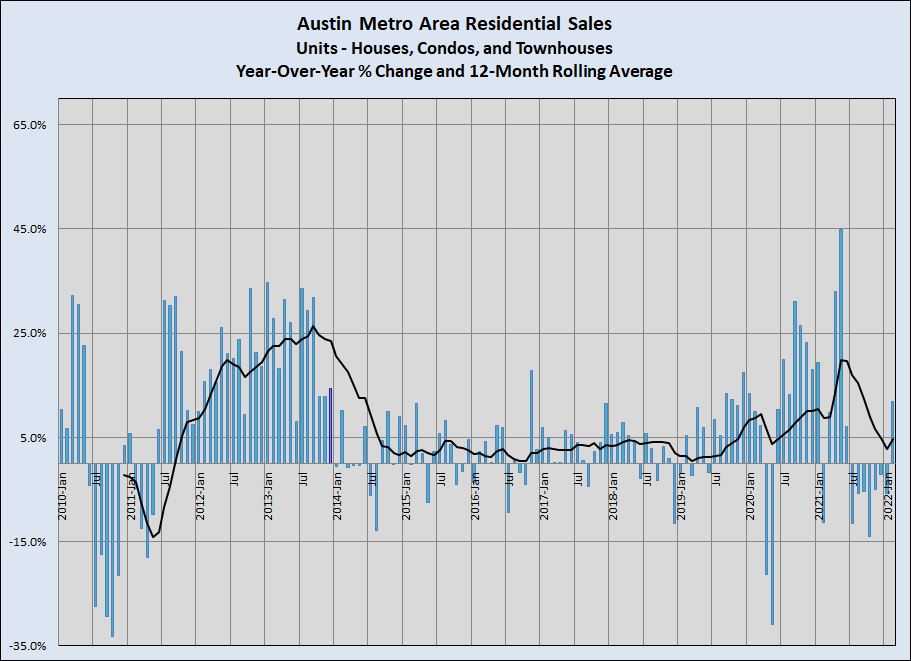
The very low supply hampered unit sales, down year-over-year for all of the second half of 2021. We saw that metric jump again in February 2022, though:
And although year-to-year price escalation slowed a bit, it remains very high — 22% in February. This chart shows the extreme contrast in price growth for the last two years compared to the previous ten years:

The challenge of being a prospective home buyer in the Austin area continues. In New Homes vs. Resales — Are we making progress? I discussed building permit activity in 2021, which should be a sign of things to come for new construction in 2022. We remain largely gridlocked in gaining resale listings because homeowners who want to sell will become buyers too and face the supply limitations themselves. I have visited many home builders over the past week, and found them still with limited capacity. They need to make larger contributions to our total housing supply in the coming months, but uncertainties about the the availability of labor and materials are hindering that growth. I’ll keep you in touch with that important part of our market.
I’ll publish a quarterly review of my Market Dashboard when final March data is available in a couple of weeks. You can expect to see our supply-limited market environment to remain firmly in place.

Discussion
No comments yet.