A few days before Christmas I posted Changes to Watch, with a preliminary look at two metrics that succinctly show what Austin-area resale home sellers and buyers experienced last year. Now that 2021 is over and December closings are all reported, I have assembled a more complete look at home prices and market velocity over the past three years:

Sale prices began climbing steadily as Days to Sell fell in early 2020, but the most obvious feature in that chart is the steep increase in prices in the first half of 2021, especially January through April. I’ll discuss that more a little later.
Notice that in February 2020 the Median Days to Sell fell from 16 to 7 days, and it has not been above 10 days since then. Notice also that the Average Days to Sell declined from a peak of 46 days in January 2020 to a bottom of 9 days in June 2021. Since that point, the average has risen faster than the median, meaning that many of the sold listings that were on the market longer than the median were on the market for much longer. These annual figures for the past 10 years make this change more meaningful:
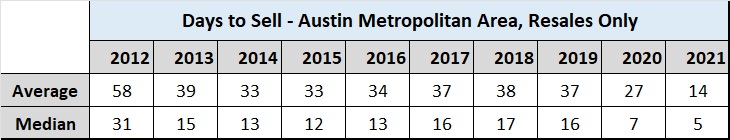
Since the current, very long, market cycle began in 2013, our market has been moving very quickly, but the past two years stand out dramatically.
As I have commented for years now, our challenge is inventory. Demand for housing in the Austin area shows no signs of weakening, with major employers moving and expanding here and with new business creation continuing. Here’s something that never happened before in this market cycle or in any other that I can find:
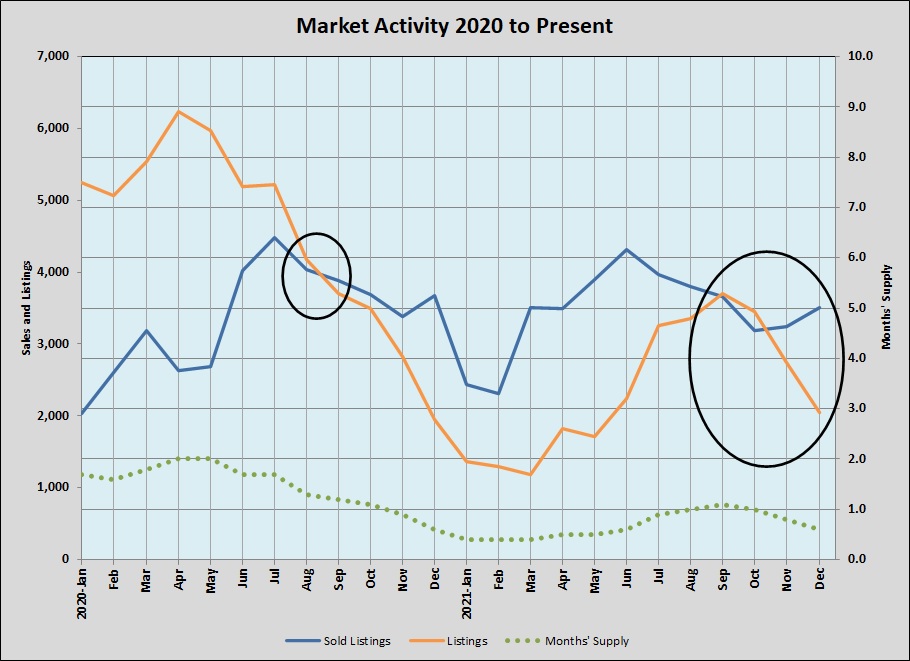
The circled areas of that graph highlight the key issue, showing that in September 2020 we sold more homes than we listed. In September and October of 2021 that condition changed briefly and in a very small way, but look at November and December of 2021!
At the top of this post I pointed out the rapid price increases in the first half of 2021. That trend coincided with the growing gap between sales and listings. By the middle of the year, our severe inventory shortage was more obvious and the quality of much of that inventory was declining. The gap in December 2021 is not encouraging, but median sale prices in November and December were almost flat, perhaps owing to the holiday season.
Forecasting this market is more challenging than ever, but with less than one months’ supply available for sale it’s reasonable to expect that 2022 could look a lot like 2021 unless something outside our area disrupts the larger economy. Rising mortgage interest rates could calm things a bit, but with resale listings gridlocked new home builders are our best chance to serve that still-growing demand.
I’ll share more details and provide a longer-term perspective on our market in 2021 Market Dashboard Recap and continue to report my own experiences in the field along with key market data.

Discussion
Trackbacks/Pingbacks
Pingback: 2021 Market Dashboard Recap | Bill Morris on Austin Real Estate - January 23, 2022