For long followers of this site, you’ll recognize this collection of market data that I have assembled and used for many years as an objective look at the residential real estate market in the Austin metropolitan area. I have commented frequently here about individual charts and the trends they showed, but it has been a long time since I discussed the entire dashboard here the way I do during in-person presentations.
The data in my dashboard goes back to January 1990, so it’s easy to view and compare multiple market cycles when needed. For this post, I’ll focus on the current cycle:
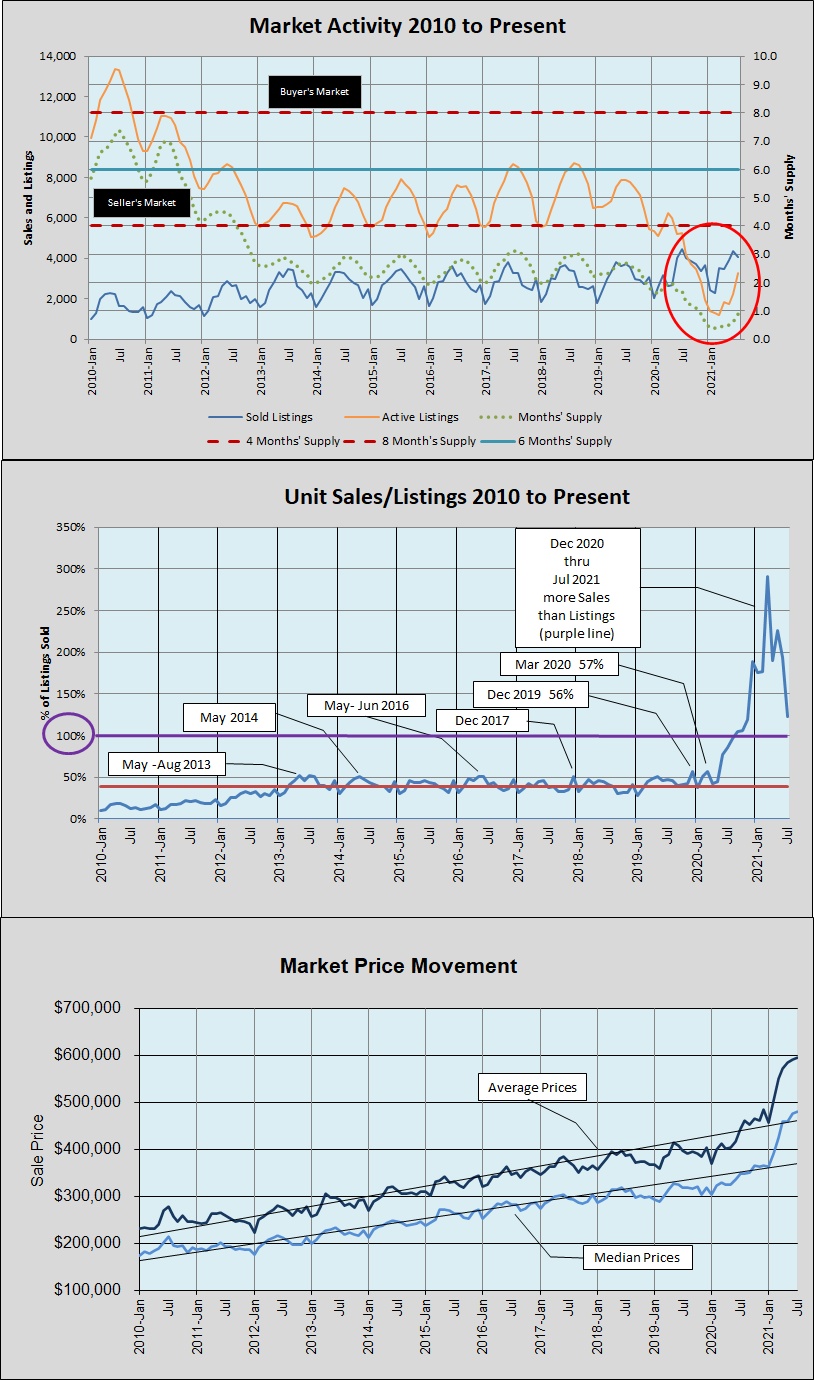
The top chart tracks Unit Sales (blue line), Listings (orange line), and Months’ Supply (dotted green line) — the supply-and-demand dynamic all in one. The generally accepted condition of a “balanced market” is 6 months’ inventory for sale, and the light blue horizontal line shows that level. The last time we had that kind of inventory here was in the first half of 2012 — our year of recovery from the Great Recession. From 2013 through 2019, our inventory was between 2 and 3 months. In 2020, we dipped below 2 months’ supply and haven’t returned.
A very important — first-ever — change happened in September 2020. You can see it in the top chart, where the orange line (listings) falls below the blue line (sales). You can see it even better in the middle chart, with the ratio of unit sales to listings at more than 100%. It was just under 200% from December 2020 through February 2021, peaked at 291% in March 2021, and generally trended down since then, with July 2021 at an 8-month low of 123%.
In the bottom chart, you can see what environment did to sale prices. You can also see a bit of flattening of the price curves as inventory pressure eased just the little bit you saw in the middle chart. We have gained some inventory since March, but the number of listings available in July 2021 was still almost 40% lower than July 2020 (and July 2021 unit sales were down 10% from July 2020 and down 7.5% from June 2021).
During this year, many buyers simply gave up and renewed leases or made other arrangements instead of buying homes. Other prospective buyers were priced out of the market where they wanted to participate. Home builders are making some headway, but are still behind demand, amid unpredictable materials costs, limited supply of labor, and still-limited inventory of permitted, buildable lots. At the same time, although we have added some resale inventory, many prospective sellers stay out of the market because they can’t (or fear that they won’t) find their next home at a price they are willing or able to pay.
The market is trying to find balance, it’s a struggle. Our home prices are still attractive compared to other tech-centered market areas, and our strong and growing supply of knowledge workers continues to attract employers and business creation. In addition, the Austin remains a great place to live with pleanty of green spaces, the lakes and hills, a lively entertainment industry, and a climate that many people are drawn to. However, this search for balance will be erratic — even messy — until we are able to build back toward 3 to 4 months’ supply of homes on the market. We will not see a broad dip in prices, although some areas and market segments may feel this process more than others. What we will experience is a series of surges and pauses, maybe over the next couple of years. If you’re considering selling or buying, let’s talk about how these changes affect your plans specifically.

Discussion
Trackbacks/Pingbacks
Pingback: Unit sales and home prices decline | Bill Morris on Austin Real Estate - October 5, 2021