Released this week:
Home prices surged in April at a ‘truly extraordinary’ rate, S&P Case-Shiller says
“Truly extraordinary” it is. Here is a key chart from that article:

Austin is not one of the Case-Shiller cities, but compare the chart above to year-over-year price changes in the 5-county Austin area:
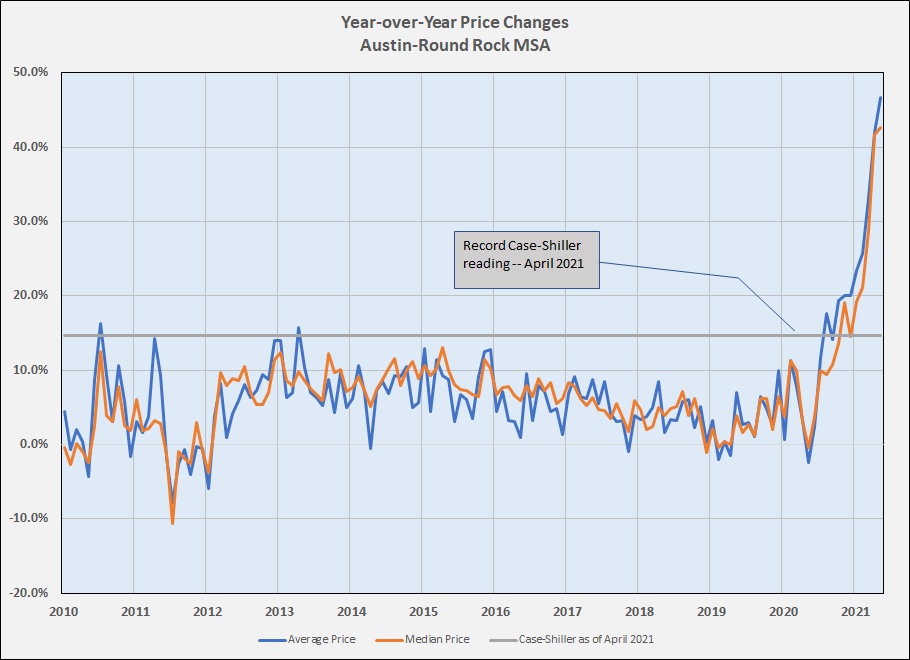
The general shapes of those graphs are very similar, but as I pointed out in a previous post (Case-Shiller Index and Austin, July 2019), we did not experience the the same dip in 2013-2015 that the Case-Shiller cities did. The Case-Shiller National Home Price Index was up 14.6% in April 2021 over April 2020 — an all-time record for the index, and three of the cities used in the index were up more than 20% — Phoenix, San Diego, and Seattle:

The important difference, though, is the magnitude of the sharp upturn over the past year. To make that easier to see, I added a gray horizontal line on the Austin price graph, showing the 14.6% Case-Shiller highest-ever reading. Note that home prices in the Austin MSA passed that pace of change many months ago. “Truly extraordinary” is an apt description of the Case-Shiller numbers. Pick your own adjective to describe what has happened in Austin, with median and average prices in April up 42% from a year earlier, and with the average sale price in May 2021 up 46.6% compared to May 2020! (For comparison to the monthly changes shown above, the median sale price in the Austin area was up 9.9% from February to March, and 8.24% from March to April. It was slower in May, but that’s a subject for another post.)
The Case-Shiller index forecast calls for continuing growth in the coming year, although at a slower pace that the recent trend:
Corelogic: U.S. Home Price Insights
I have seen some hints in recent weeks that the frantic pace of bidding wars and price growth could calm a bit in the Austin area, but the supply of housing here is far from serving the strong and growing demand, and I expect competitive multiple offer situations and price appreciation here to continue, with faster price growth than in most or all other large cities, and faster than the National Home Price Index. This bears watching. Come back to BillMorrisRealtor.com for continuing updates.

Discussion
Trackbacks/Pingbacks
Pingback: Cash-Shiller Index – How do we compare now? | Bill Morris on Austin Real Estate - February 23, 2022