At the end of ABJ: Nope, this isn’t a bubble I suggested that local land use policies and zoning decisions could be part of expanding the supply of housing in the Austin area if they allowed more flexibility in the types of housing and variety of price ranges available . Changing development patterns is complicated and controversial. It can also be a critical step for a city and a region that are growing so quickly.
Streamlining the review and approval of land development and construction permits is an important element of this issue, but the types of permits available are critical in providing a full range of housing types across the region. This look at the history of building permits in the Austin-Round Rock MSA is instructive:
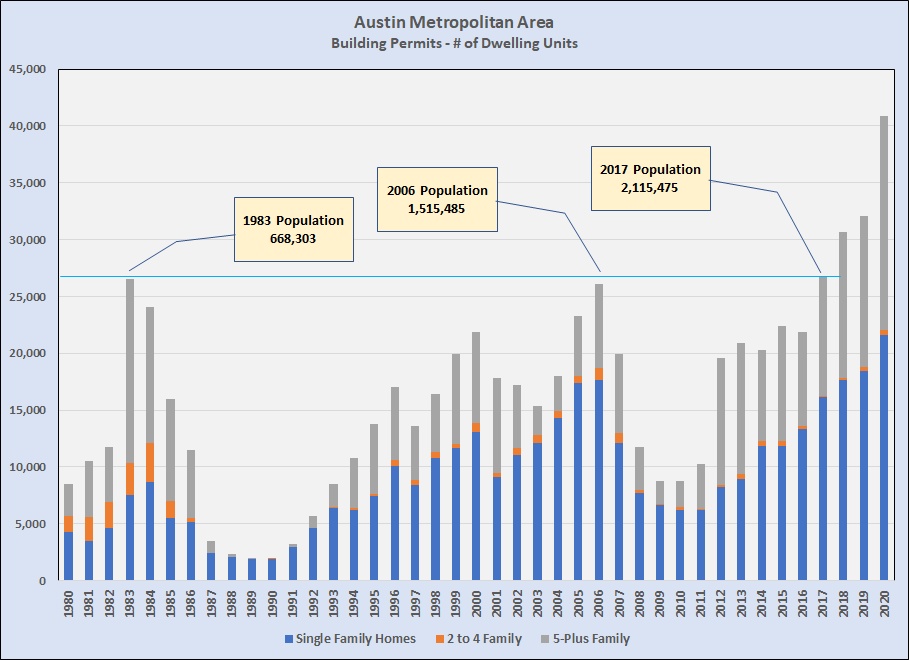
Note that the peak in total new permits during the last market cycle was in 2006, and then the mortgage industry’s collapse happened. The Austin area entered a strong recovery from that downturn in 2012 and was firmly in the hold of a very lopsided seller’s market in 2013. But even with booming job creation and population growth, it took until 2017 for the total number of dwelling units approved to exceed that 2006 peak. Obviously, we have made some progress since then, but the population grew 40% before permitting activity caught up with the 2006 level — 11 years later. (And notice that population in 2017 was more the triple that in 1983, the only other time that many permits were approved.) The extreme under-supply we’re experiencing now shouldn’t be a surprise.
Now … back to the topic of housing diversity. We have added a lot of apartments in the Austin area in recent years, and conditions in the leasing market indicate that we’ve largely balanced demand there, at least for now. What we don’t have enough of is smaller projects that are often referred to as the “missing middle.” In the chart above, look at the distribution of housing types and how it changed over the years. Importantly, single family homes were half or less of total new units approved from 1980 through 1986 (and before, although specific data is harder to get for earlier years). Single famly homes have represented much more than half of all approved permits almost every year since then. We have lost the segment of housing that could best contribute to the total supply and to expanded affordability for more of our growing population, either as tenants or owners.
The space between single family homes and apartments is the market segment that could serve residents who don’t like apartments but can’t afford to buy or rent single family homes. The true missing middle could easily include low-rise condominiums, co-ops, or 5 to 10 unit apartments, but for the purpose of this post, let’s just consider 2 to 4 Family structures as an indicator.
There were a total of 429 Residential Income properties sold in our 5-county metro area in 2020. Sorting those by Year Built yields this distribution:
- 340 built before 1990 — 79.3%
- 29 built between 1990 and 1999 — 6.8%
- 30 built between 2000 and 2009 — 7.0%
- 24 built between 2010 and 2019 — 5.6%
- 8 built in 2020 — 1.9%
Another important fact about that list is that ALL of those properties were duplexes and fourplexes. NONE of them included more than 4 dwelling units.
In case you’re thinking that 2020 was different than “normal,” here’s a look at the 5,580 Residential Income properties sold in the previous 10 years, 2010 through 2019:
- 4,538 built before 1990 — 81.3%
- 312 built between 1990 and 1999 — 5.6%i
- 484 built betwen 2000 and 2009 — 8.7%
- 246 built between 2010 and 2019 — 4.4%
Of the Residential Income properties sold in the last decade, 83% were duplexes (4,636). The rest were fourplexes (944). For comparison, over the same years 118,882 single family homes were permitted (and 273,332 were sold).
For a better comparison with the current market cycle, this table is helpful:
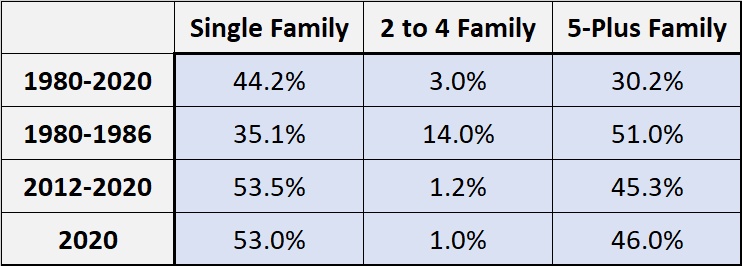
For the entire 41-year period covered here, the 2 to 4 Family segment represented just 3% of all newly permitted construction, but look at the early 1980s, when almost two-thirds of new permits were for multifamily units, with 14% in the 2 to 4 Family space. Compare that to the current market cycle, with 2 to 4 Family units being just 1% of newly created housing stock.
It’s important to note that in the early 1980s, the city of Austin represented a very large part of the population and job market across what is now a metropolitan area. In that context it’s important to recognize that Austin adopted its current land develoment code in 1983. It isn’t coincidental that construction of “missing middle” housing peaked in 1983 and 1984. The reason is that the 1983 code largely blocked construction of anything other than single family homes. After more than 30 years of amendments the code is much more complicated and confusing, and sometimes even self-contradictory, but it is still very hard to build anything between single family and large multiple family projects, with the large projects almost always permitted as Planned Unit Developments or other special exceptions to code requirements.
If you want to see what the expansion of missing middle housing could look like, drive through some of our most loved older neighborhoods — Tarrytown, Hyde Park, parts of West Campus and North Campus, much of Central East Austin — and you’ll find a lot of missing middle housing that was built before 1983. You may have to look carefully because those structures blend so beautifully with surrounding single family homes. Zoning policies that make it easier to do that now could help build a more affordable future for many buyers and tenants now across the entire metropolitan area.
In the suburbs, there are some moves in that direction, but this need should be addressed intentionally across the metro area. The land where new housing can be added has gotten more expensive in recent years, and missing middle housing distributes that cost much more efficiently than single family homes while still allowing residents to enjoy a small yard if they want, access to garage spaces, private entries … and the ability to build equity for a move up in the future if they wish. At this point, our market is making entry-level housing very difficult for many. (See Market price distribution — more growth in 2021? for more on that.) Let’s work on that vital part of our community.

Discussion
No comments yet.