Yes, it has been hot! And yes, many of us have been locked down due to the coronavirus and many will not return full time to offices for a long time, if ever. The impact of this period on commercial real estate will be felt for years, but the situation for residential real estate is very different. A quick look at my market dashboard tells much of the story about the Austin metropolitan market:
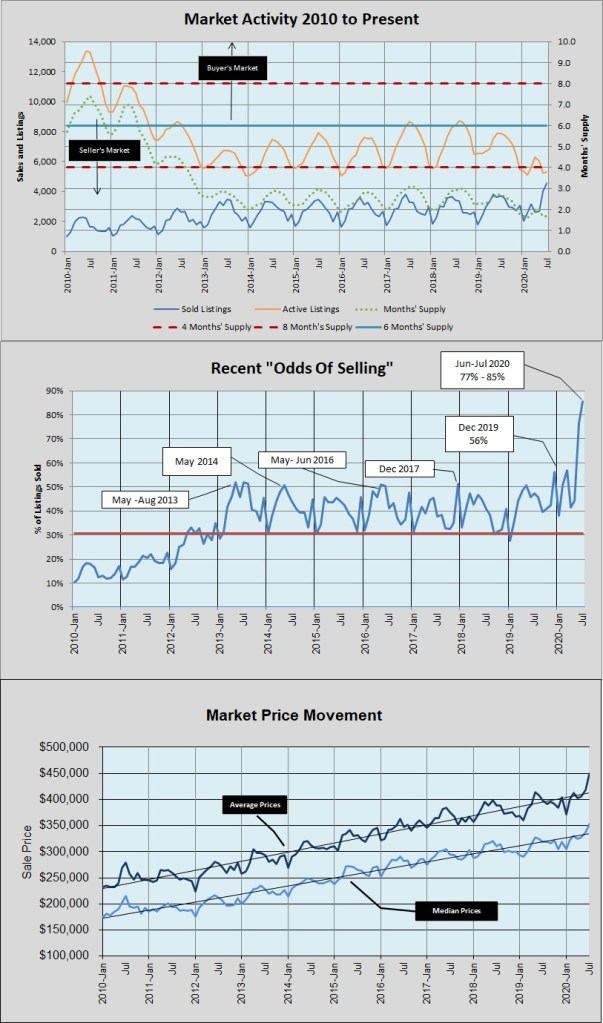
Look first at the “Odds of Selling” chart in the middle and notice the percentage of active listings sold in June and July — 77% and 85% respectively. December 2019 was the highest point ever for this metric until this summer, but that record has been retired now!
In the bottom chart you can see what that level of demand did for average and median prices, pushing them steeply upward.
The top chart aggregates the supply vs. demand picture, with the orange line showing the number of active listings by month and the blue line showing monthly unit sales of houses, condominiums, and townhouses in the metro area. The green dotted line shows how long listing inventory will last if the month’s sales pace continues into the future. You can see the number of listings declining rapidly as inventory is consumed, and notice that the “months’ supply” line has been steadily falling this summer, to well below 2 months. We have now been at or below 2 months’ supply of active listings for eight consecutive months!
NOTE: Reported MLS unit sales for August look lower than July, but after that is refined in the coming weeks, and as non-MLS new home sales are accounted for that total will change. That also explains the tremendous increase in reported sales compared to the figure I shared in a previous post with one week of July closings left to go.
The next two charts show those impacts even more clearly. First, look at the change in unit sales in June and July:
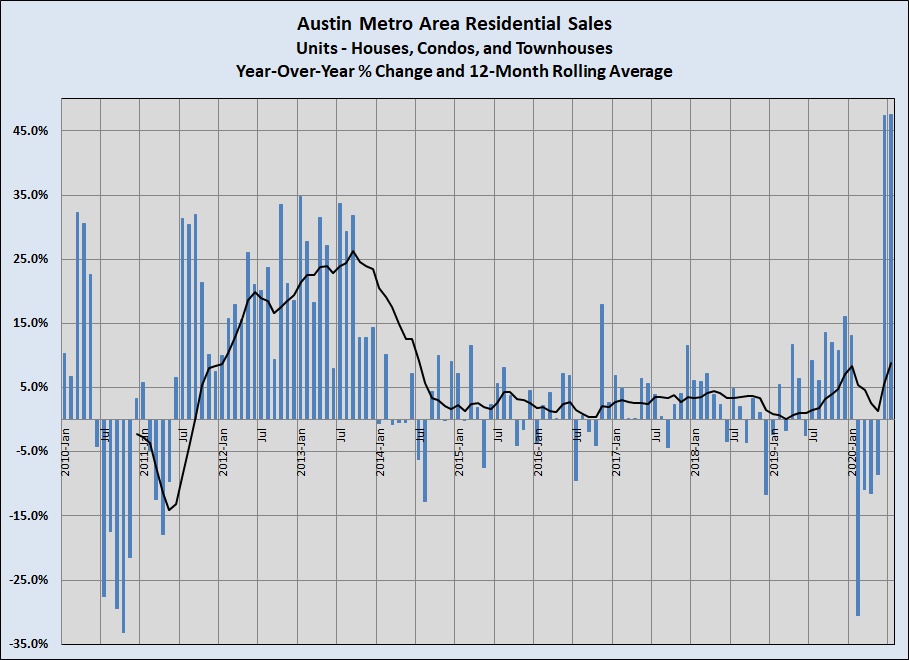
If you see bars showing sales 47.5% higher in June and July than the same months last year, it’s not your imagination. Even during the first three years of this incredibly long market cycle, the pace of unit sales peaked at 35% year-over-year growth. It’s also worth noticing how volatile the eleven months were leading up to the June-July spike. I have been telling you for a long time that our market is supply-constrained, but as we began to open much of the economy, demand overpowered the effect of limited inventory.
And you can see the impact on home prices:

In 2020, the pace of increase has been at or above 10% in three months out of seven — a rate last seen at the end of 2015, almost five years ago. (In only two months during the past eight years has the median price of a home in the Austin metro declined year-over-year, coinciding with declines in unit sales in December 2018 and January 2019.)
With a contentious election approaching, unemployment remaining much higher than pre-coronavirus (but declining), and with housing supply still extremely low, what comes next is worth watching. The underlying strength of our local and regional economy continues to generate employment and population growth, and if workers don’t return to offices then housing demand will change and likely continue to grow. How homeowners, home builders, and prospective home buyers respond remains to be seen. Stay tuned.

Discussion
No comments yet.