With the latest refined data from the Texas A&M Real Estate Center, I have updated my market dashboard. I have commented many other times on how our residential market environment now compares to previous market cycles over the past thirty years, and I have offered more commentary and explanation than I will in this post. This time I’ll comment on four specific numbers that really matter in this very long market cycle — now going on eight years in an extreme seller’s market. The numbers are: 2, 75, 11, and 14.
Here’s the graphic:
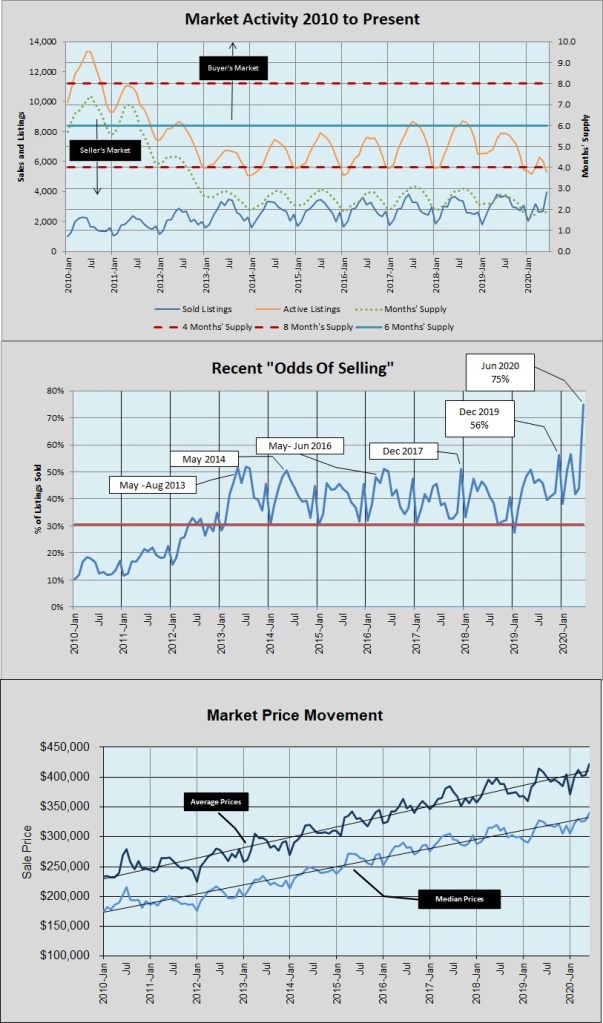
In the top chart — Market Activity — notice that our Months’ Supply has been at or below 2 months for seven consecutive months. That has never happened before.
In the second chart — Odds of Selling — notice that 75% of active residential listings sold in June 2020. Compare that to the 10-year average of 30% and to the fourteen times — ever — that this metric was at or above 50%. June’s “odds of selling” was unimaginable, even in this incredible market cycle, but it happened.
In the bottom chart, you won’t see the numbers but you can see the change in home prices between January and June 2020: median price up 11% and average price up 14%, Those are not especially unusual during the past eight years, but they are the fastest increase for the first half of any year since 2016.
As I have told you for a long time, that price growth is still driven by supply and demand. I have also told you for a long time that our market is supply-constrained, and I remain confident that we could sell more homes if we had them to sell. Look at the orange and blue lines in the top chart above. Sales soared over the past three months following an increase in the number of listings in March, April, and May, but the total listing inventory is now down to the level it was in January. In total, from June 2019 to June 2020, unit sales increased 10%. At the same time, the number of active listings decreased by 33%!
Stand by for more in the coming weeks and months. On the 18th of 23 business days in July, MLS-reported sales are 63% of the end-of-June total. With a month-end surge July might match June, but it will certainly match or exceed unit sales in January, February, March, April, and May. I’ll update you as we learn more.

Discussion
No comments yet.