I have written recently about supply and demand and affordability issues in the Austin market for residential real estate (Austin Housing: supply, demand, and prices and Following up on Austin housing supply), but I haven’t shared my broader view — a “dashboard” that I assembled when prospective home buyers started asking me in 2008 or so to predict the market “bottom” after the mortgage industry meltdown.
As I have told my clients, I don’t believe any of us can be certain when the market has made a transition into a growth phase until a few months after the transition actually happened. There are some metrics that are helpful, however, and this post includes data through September 2019. “Clean” month-end data from the Real Estate Center at Texas A&M University is usually available about the 20th of the following month, and I will be watching the market, as always.
Every month I update three charts as the core of my market dashboard:
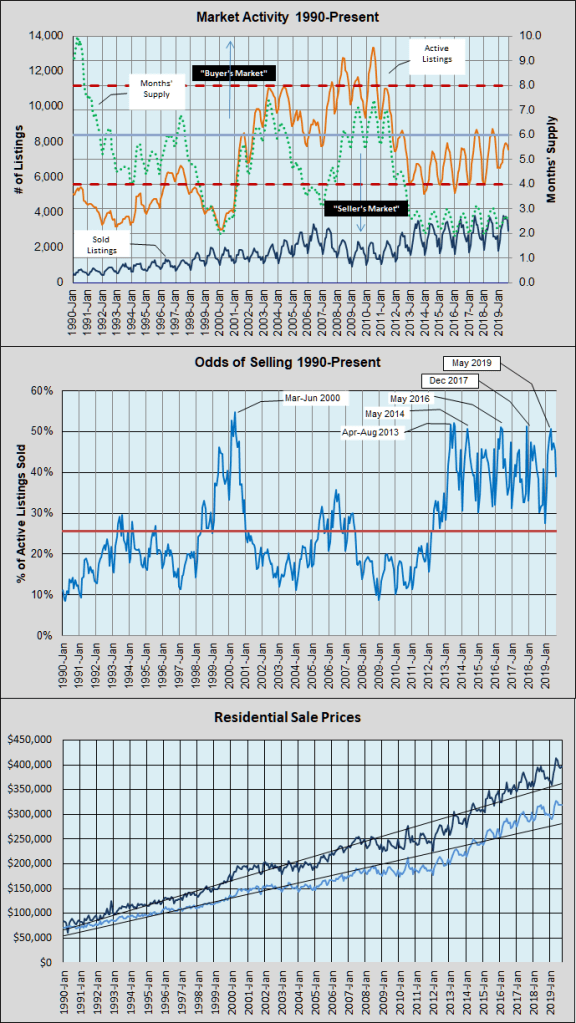
In the top chart, the orange line shows the number of active listings in each month (houses, condominiums, and townhouses). The blue line shows how many listings sold each month. The green dotted line is “Months’ Supply” — how long the listing inventory will last if the pace of sales continues unchanged.
I have added a horizontal line approximating “normal” or “balanced” market conditions — 6 months’ supply available for sale. We are now in our seventh year with half of that inventory level or less. That’s why quick sales, multiple offer situations, sales above list price, and continuing year-over-year escalations of home values across the Austin area have been common, and will likely remain so for some time to come.
The second graph shows the odds of an active listing selling each month — not the odds of a specific listing selling, but a snapshot of what percentage of all active listings actually sold. The average across that almost-30 year period was 26%, but notice how different the last seven years of extremely low inventory looks compared to the prior years. Since January 2013, the “odds of selling” have averaged 41%!
Before this market cycle, this metric was 40% or higher in only 12 months and at or above 50% in three months (all in 1999-2000). Over the past 81 months, it has been 40% or higher in 47 of them and 50% or higher in 8 months.
Refer to the third chart to see what those market conditions have done for home prices. First, notice that the Austin metropolitan area has not suffered greatly through any of the market downturns. For clarity, it’s important to know that some specific neighborhoods and market segments were seriously impacted in each downtown, but in the aggregate we were not affected in the way that other parts of the country were (with huge losses of home value in whole cities and floods of foreclosures for sale).
Instead, what we experienced generally was a flattening of home prices that slightly lagged downturns in the odds of selling, and increases of home prices above the long-term trend led by increases in the odds of selling. You can see that both median and average home prices have grown faster than the trend-lines for all of the past five years. For almost thirty years, however, the trend for Austin-area home prices has been upward, averaging almost 6% per years.
Of course, no market for any product goes up forever. That’s why I began studying some other metrics over the past year — to examine whether and how this cycle is maturing. It is maturing, as indicated by trends in “days to sell” and in the number of expired listings. All in all, though, we’re just watching the proper function of a market, and demand for Austin’s highly educated workforce and for the attractive lifestyle that Austin represents will continue to support growth for a while yet.

Discussion
Trackbacks/Pingbacks
Pingback: Home Price Index comparisons | Bill Morris on Austin Real Estate - November 15, 2019