The National Association of Realtors® reported recently that sales of existing home sales were down in July, following the expiration of the latest round of homebuyer tax incentives. I commented then (No incentives, slower sales? No kidding!) that Austin and Central Texas matched the national trend, and that noone should be surprised. I also noted (Impressive sales performance for premium properties!) that lower priced properties, predictably, were affected most by the tax credits.
That NAR report and my posts focused on single family homes. I decided now to broaden that discussion to include all residential properties, from mobile homes to condos and townhouses. Here is a look at the past twelve months in the Austin metropolitan area on that basis:
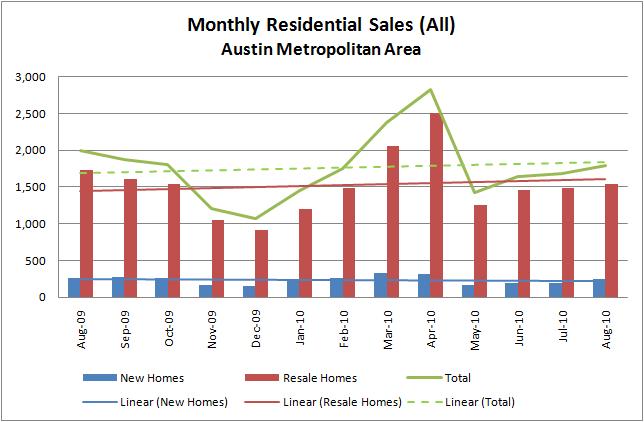
You can see that monthly sales, in total, have continued to rise slightly. Virtually all of the increase, recently and over the past year, was accounted for by resales. New home sales have been basically flat.
How about the contribution of foreclosed homes?

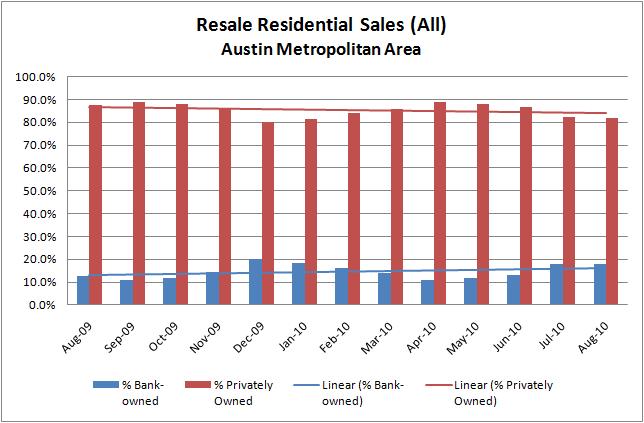
Among resales, foreclosures accounted for virtually all of the growth in the past year, but the percentage remains low compared to many other major metro areas.
Finally, NAR reported this week that the Pending Home Sales Index improved somewhat in July, and the South (the reporting region that includes Texas) participated in that improvement. The month-to-month (June 2010 – July 2010) in the South was outpaced by the West, but the annual decline in the PHSI was smallest in the South.

All in all, although the effects of the recession are recognizable even in Central Texas, we continue to weather this financial storm better than many. We are a few weeks away from having final data for August 2010, but based on my personal experience and anecdotal evidence from colleagues I believe we will see that new contracting activity remains relatively healthy — still below our market’s performance compared to 12 and 24 months ago but growing slightly.
As I have commented elsewhere, prospective home buyers have an incredible opportunity right now — increased listing inventory (including a few more short sales and foreclosures than in the past), record-low mortgage rates, and stable or slightly increasing demand that should push prices up over the next six to twelve months. Those who choose to sit out this part of the market cycle are likely to look back in two years and say, “I should have moved then.”

Bill thanks for the data. I would be nice to get more price data rather than volume. Prices seem more important than how many homes sell. I’d love to see a YOY breakdown on sold prices by zip code.
Posted by Mr. Bubble | September 4, 2010, 11:15 PMThanks for your comment, Mr. Bubble. I plan to comment on supply/demand and pricing in the coming week, although “by zip code” is more granular than I will likely have time for. For now, see http://www.AustinMarketDashboard.com. It’s updated through July. Final data for August will be available in a couple more weeks.
Posted by billmorrisrealtor | September 5, 2010, 8:12 AMWhile I’m making time this week for my next round of analysis, I thought I would point you toward another recent post in case you missed it: https://billmorrisrealtor.wordpress.com/2010/08/27/impressive-sal…ium-properties/
Posted by billmorrisrealtor | September 8, 2010, 4:43 AM