As a follow-up to Yes, the market has changed … this post focuses on three key metrics in the market transition the Austin residential market has experienced in recent months.
First, this chart shows median Days to Sell and Median Sales Prices of resale homes from the bottom of the last market cycle through August 2022:
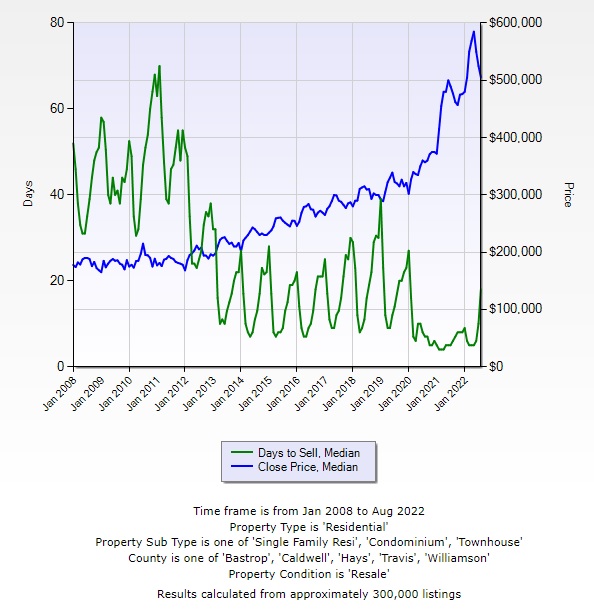
From October 2010 through February 2011, sold homes were on the market for a median of more than 60 days. Since January 2012, we have gotten used to a market boom, with the median time to sell averaging 13.5 days for more than 10 years. Since January 2020, that median was just 6 days! By comparison, our market has slowed in 2022. Focus on just 2020 to now:

Days to Sell has tripled since June — to 18 days — but it’s still below the pace that we considered “normal” before this cycle..
Now consider what has happened to home prices. During this year’s transition, we have seen resale prices fall 14% from the all-time high in May 2022. The median closed price in August 2022 was still 6% higher than the same month last year, though, and 41% higher than two years ago. Even with recent declines, the median sales price across the 5-county area was up 69% from August 2017, just five years ago!
In a search for market equilibrium amidst the combined forces of accumulated price resistance, rising mortgage interest rates, and growing resale inventory, pricing has been challenging in recent months, as indicated by the ratio of actual sale prices to original list prices:
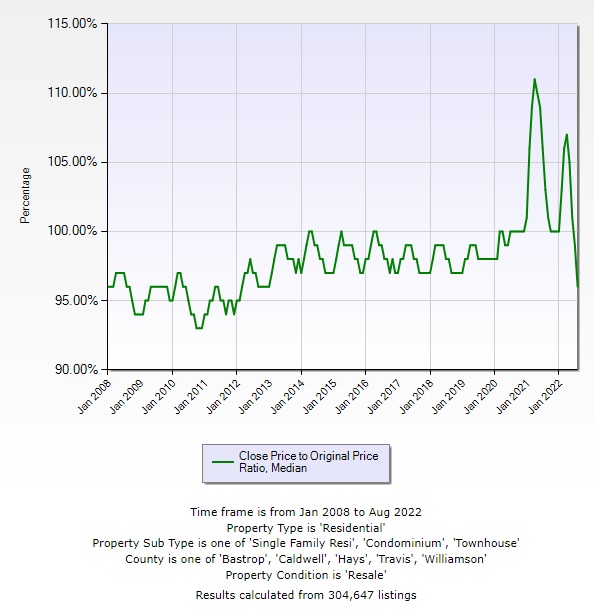
At the end of the last cycle, the ratio of sales price to original list price dipped as low as 93%. From 2014 through 2016, seasonal peaks hit 100%. In the first half of 2020, when more homes were sold each month than were listed, the median ratio was over 100% for nine months, and spiked again for six months in 2022. In August, it fell to 96% — below the average for the past ten years. But note that the annual minimum in 2013 was also 96% and was 97% from 2014 through 2019. The pandemic years reset our expections, but the Days to Sell metric was very unusual since 2020, even compared to the first eight years of this boom.
This market adjustment has been needed for quite some time, and it’s not over yet. We will likely see Days to Sell grow and List Price-to-Original Price decline further, and more month-to-month price declines are probably ahead, but historical perspective is important. The growth in home equity in this market cycle is nothing short of incredible, and demand for homes in our region remains very strong. The outlook remains positive. I’ll keep an eye on the market and keep you informed.

Discussion
No comments yet.