If you’re involved with Austin-area residential real estate or just casually reading market news, you’re probably not surprised that home prices have been rising quickly in Central Texas. The imbalance between the demand for housing in and around Austin and the available supply of homes has been significant for years, and it has reached truly unprecedented extremes over the past few months. I’ll share details in a separate post, but for those of you — especially prospective home buyers — who are frustrated with our market conditions, I hope comparing our situation with the just-released Case-Shiller indices will be enlightening. (This probably won’t help your frustration, but under the heading of “… misery loves company ….”
The newly available Case-Shiller data uses 2000 as the index year. Using 12-month rolling averages of monthly average and median prices for the Austin metropolitan area, also indexed to 2000, you can see that our prices have risen more during the past two decades than Case-Shiller’s National and 20-City indices:
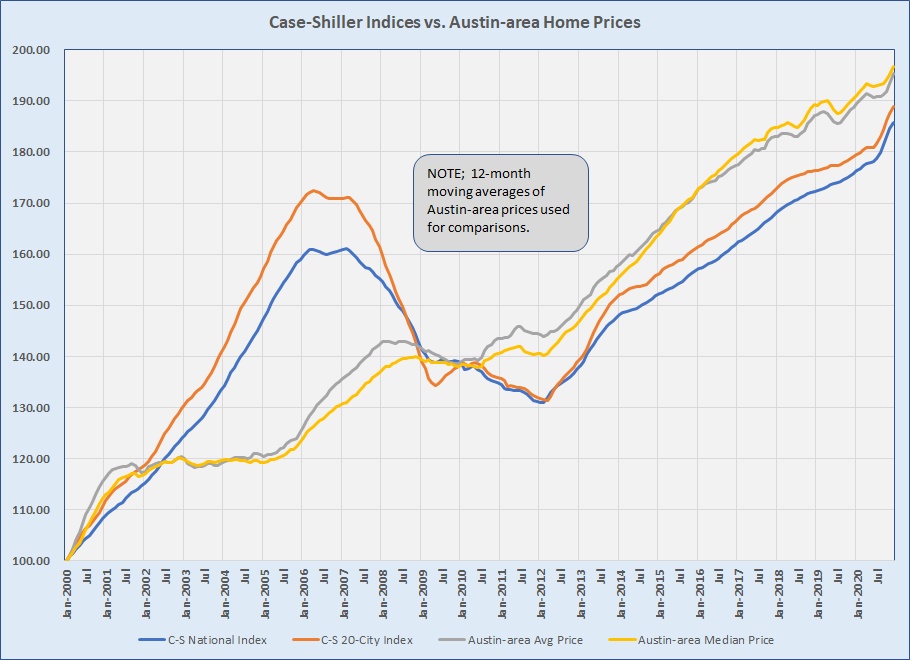
Just comparing the levels of those four lines at the far right end of that chart ignores other important differences, though. Yes, all four sets of data are “zero’d” at January 2000, but look at 2002 through 2008 and you’ll notice that Case-Shiller cities experienced the pre-correction madness in the mortgage industry through early 2007 very differently than we did here in Austin, and their decline from 2007 to early 2009 was much more dramatic as well. Prices in Central Texas essentially flattened while price indices continued to slip in Case-Shiller cities through 2009-2011. I am grateful that we escaped that volatility and the very real human impacts of home values crashing as they did in many places from 2007 through 2011.
2012 was our recovery year in Central Texas, and out very fast-paced market took off in 2013. Notice that because we didn’t experience the ongoing decline our market prices started the recovery in 2012 at a higher point relative to 2000 than the Case-Shiller cities, from that time all four lines on the graph moved almost in parallel. Reindexing the same data to use January 2012 as our base point shows that more clearly:

All four data sets declined during the 1st quarter of 2012, so you see them emerging at the bottom of the graph around March of 2012. The index of Austin-area average home prices actually stayed slightly lower than the 20-City Case-Shiller index through all nine years, while the index of our median prices was above that Case-Shiller index from 2015 through 2020. But notice that both Case-Shiller indices and Austin median prices are clustered very tightly at the end of 2020, with the average price index for the Austin area below all three. Using rolling averages of Austin prices smooths seasonal ups and downs, but it also obscures really shocking price growth over the past three months. The shortage of available housing is a significant factor in most U.S. metros, though, and I am confident that the comparisons discussed here are valid.
Yes, being a buyer in Central Texas these days can be a trying experience. I was fortunate to have successfully represented several buyers during 2020, and I have more under contract now. This can be done, but the frustration for buyers is real. The demand to live and work in and around Austin has continued to grow even as we sold more than we listed in recent months. We have consumed signficant inventory, and for reasons that I have discussed elsewhere home builders are not making the gains that they did during the early months of 2020. 2021 promises to be another trying year, but it’s worth knowing that we’re not alone dealing with under-supplied housing markets and rapidly rising prices. Hang in there!

Discussion
Trackbacks/Pingbacks
Pingback: The inventory shortage is a national issue | Bill Morris on Austin Real Estate - February 27, 2021
Pingback: Cash-Shiller Index – How do we compare now? | Bill Morris on Austin Real Estate - February 23, 2022