In What a market! 2020 Recap I told you about the unprecedented pace of sales in 2020 across the Austin metropolitan area, and the rapid decline of housing inventory over the year. That discussion deserves more attention.
That post ended with a chart showing the effect on average and median home prices as the supply of homes for sale was outpaced by demand. I discussed Months’ Supply, noting that the pace of sales versus the number of listings fell below 1 month in November and December. Another way to view market velocity — the way that active buyers and sellers experience it — is Days to Sell, the time between a new listing entering the market and that listing being under contract. Consider:
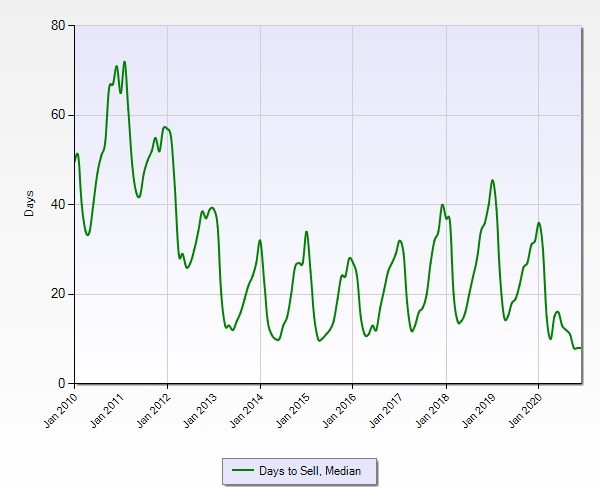
At the bottom of the last market cycle there were months when half of all listings were on the market for 70 days or more. For much of the current, very fast-paced cycle, we have seen seasonal dips to 12 or 15 days as the median time on market. You can see that the pattern was very different in 2020, and if you talk to anyone who sold or bought last year you’ll hear amazement in their stories. In October, November, and December of 2020, half of all listings were on the market for 8 days or less!
That shortage of listings led to multiple offer situations and bidding wars that we saw in 2013 through 2015, but with a new wrinkle this time: a form that featured prominently in many negotations, the appraisal waiver. That allows strong buyers to offer any price it takes to win as long as they have cash to make up for an appraisal below the contract price. That form and the presence of many cash buyers fueled the price increases we saw last year.
The year-over-year pace of those changes was staggering. These charts allow you to consider 2020 in the context of 10 years’ market history:
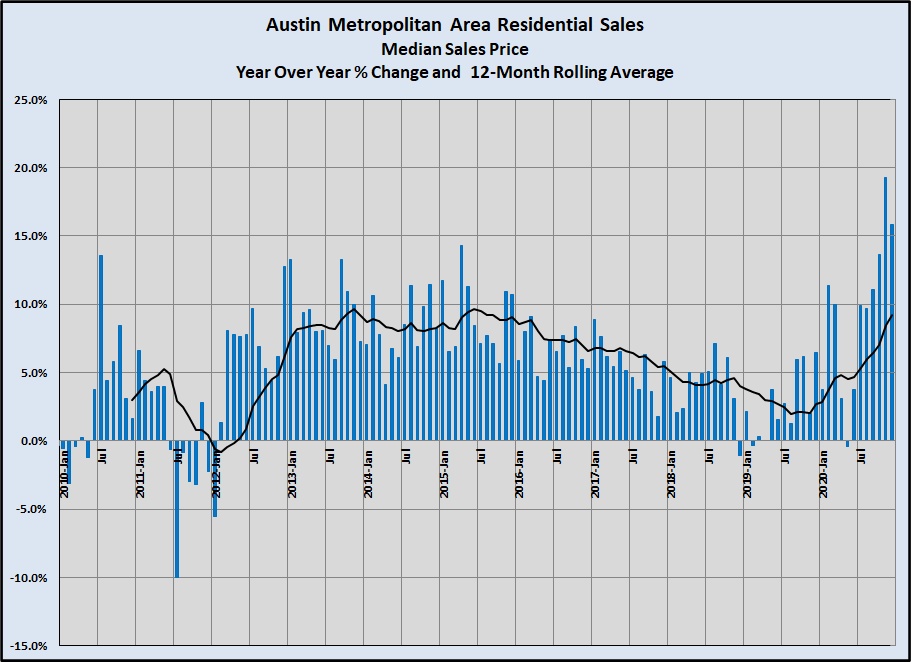
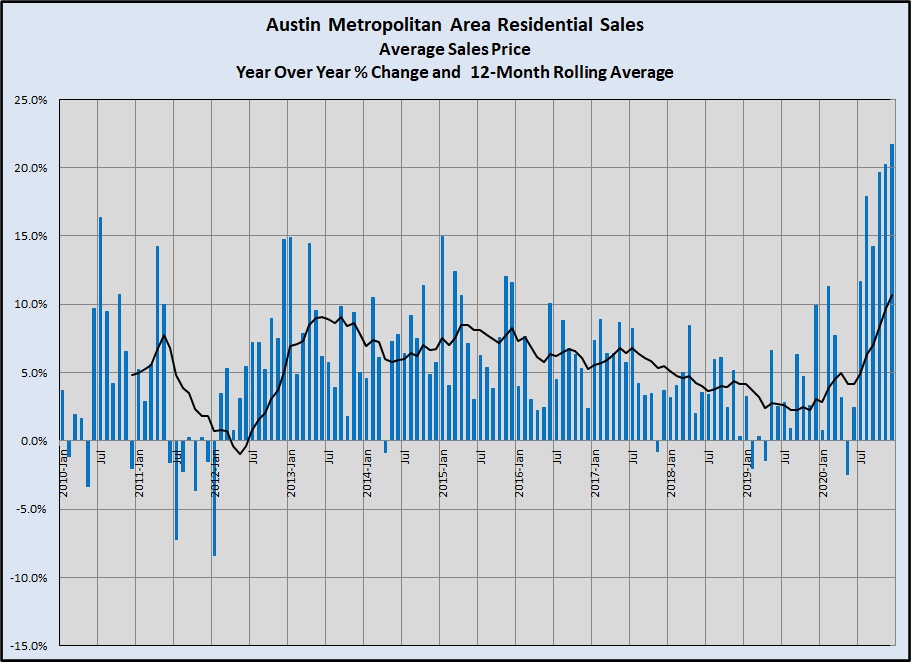
Yes, you read those correctly. In November and December of last year, the median sale price for the metro area was up more than 15% compared to 2019, and the average sale price was up more than 20%!!!
Finally, look at the slopes of the black lines in both of those graphs and compare June – December 2012 with June – December 2020. Based on personal experience in the market, that pace is continuing as we begin 2021. There was no sign of a seasonal pause this winter. The current market cycle is already very long in the tooth but there is a lot going on in the Austin-area economy, so continuing expansion of our housing market is likely. Meeting the challenge of supplying the needed housing is daunting, but Austin has doubled in size every 20 years for a long time and managed to meet that challenge.
In Market price distribution — more of this is 2021? you’ll see that these changes mean to the distribution of sales by price range across the region. Beyond this series of posts, I’ll keep you informed on the state of the Austin-area residential market, based on my own daily work in the field and with ongoing research of market statistics and our regional economy.

Discussion
Trackbacks/Pingbacks
Pingback: The Austin boom continues … | Bill Morris on Austin Real Estate - February 25, 2021