A year ago I began writing about changes in the Austin residential real estate market (Thoughts on this Market Cycle – Trends to Watch). Our regional market remains strong, driven by real demand to live in the Austin area and supported by continuing job creation.
In some ways that strong demand is our challenge because it is coupled with inadequate housing supply. Rather than looking at monthly snapshots, here is a comparison of market performance for the first three quarters for each of the past ten years:
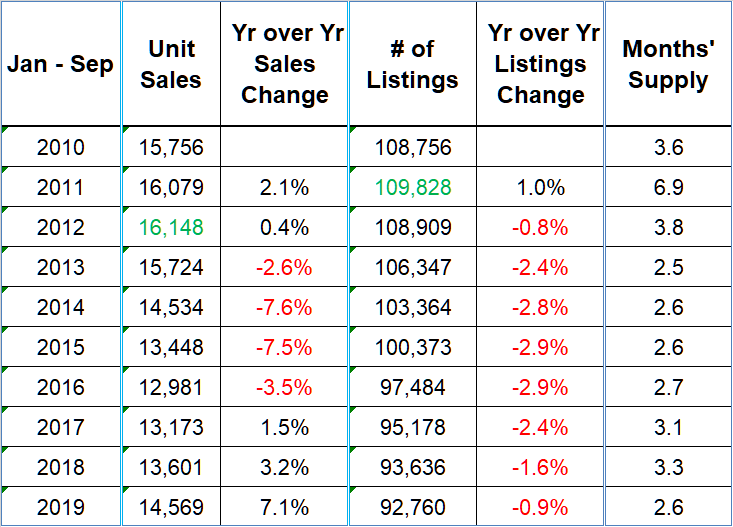
Notice that the number of homes sold (January 1 through September 30) peaked in 2012, just as we emerged from the last recession. Unit sales dropped for the following four years, but have begun climbing again more recently. The “Year over Year Listings Change” column in that table shows a key issue: Unit sales during the first three quarters of 2019 were about down about 10% from the 2012 peak, but the number of listings was down more than 15%.
The far right-hand column shows that we’ve been badly under-supplied for 7-plus years, with less than half the invenstory that most market economists consider “normal” or “balanced.” That’s a recipe for price increases, and in the aggregate home prices are still going up, but at a slower pace than a few years ago:
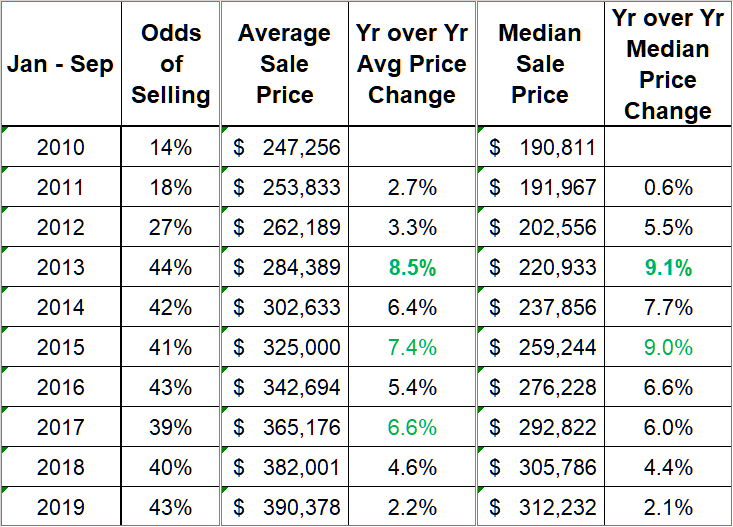
In that chart you’ll see that average sale prices for the first three quarters of each year are up 58% over the ten year period, and median prices are up 64%. The trend was downward from 2013 but as the market tried to find equilibrium they seesawed a bit through 2016. The peak in both, though, was 2015, and as of September 30, 2019 average and median prices in 2019 were up just 2% compared to the same period last year.
You can see both trends in these graphs:
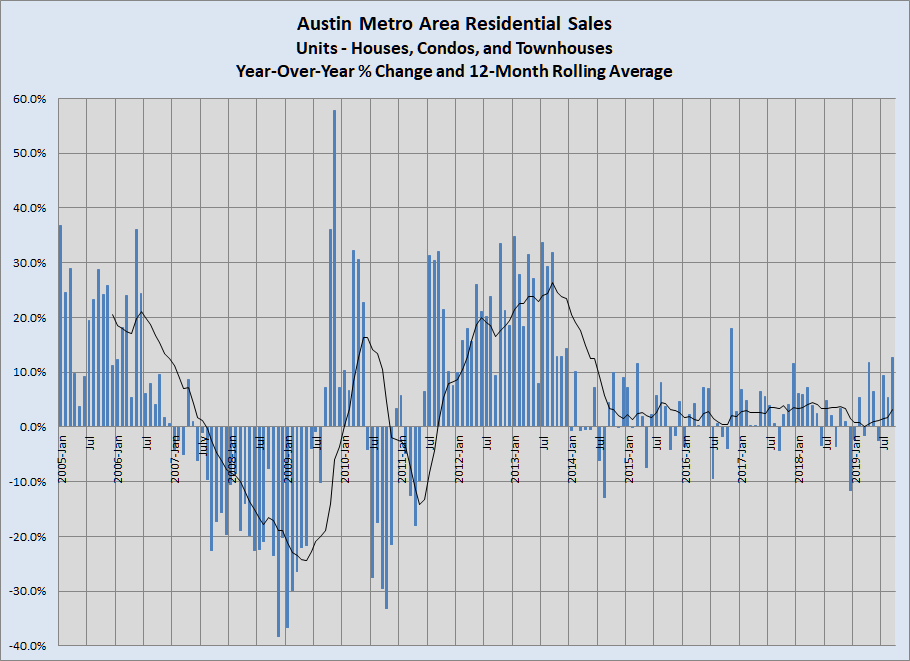

And two other metrics show a changing market as well:
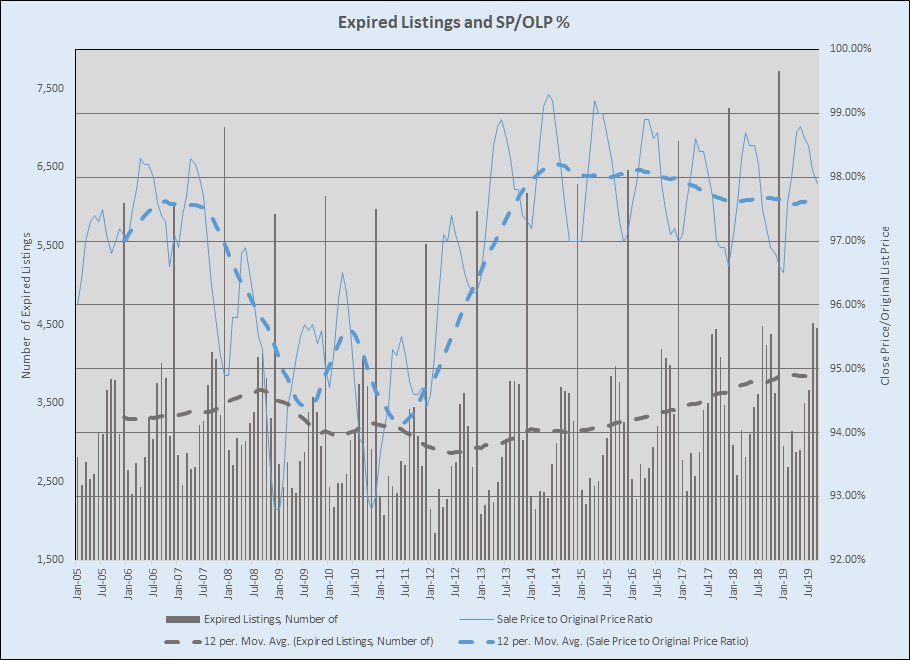
Since the Austin market area emerged from the last recession the number of expired listings has been trending steadily upward with the trend line rising from about 2,700 in 2012 to 3,700 now, a change of almost 30%. Also, as the pace of year-over-year price increases began to decline in 2014, the ratio of final sale prices to original list prices went from about 98.2% to about 97.7% — not dramatic, but noticeable.
I am not sounding an alarm here. We’re going to be fine. As I said at the beginning of this post, strong demand continues and is forecasted to continue for another year or more. It’s also worth noting that homebuilders are catching up a bit, and all of their numbers aren’t reflected in the MLS data I used in this post. So far it’s not enough, though. Home sellers in some parts of our market area should be prepared for a calmer market environment than they would have experienced just a couple of years ago, but it will remain a frustrating time to be a home buyer in the Austin area. These remain trends to watch.

Discussion
Trackbacks/Pingbacks
Pingback: Optimism from home buyers | Bill Morris on Austin Real Estate - December 11, 2019