Last week I wrote about how the distribution of homes sales in the Austin Metropolitan area have changed over the past several years (Home Prices in Austin). I trust it surprised noone that prices throughout the region have increased. Now, I want to break that down by city within the region, focusing just on reported sale prices in 2018.
The table below shows what percentage of sales in each city listed were in the price ranges shown last year. For the purposes of this post, “home” includes houses, townhouses, and condominiums. Just for clarity, “Austin Metro” covers the entire 5-county metropolitan area (Travis, Williamson, Hays, Bastrop, and Caldwell). The “Urban Core” as shown here is the area bounded by Loop 360, Hwy 183, and Ben White Blvd. With that, here’s the data:
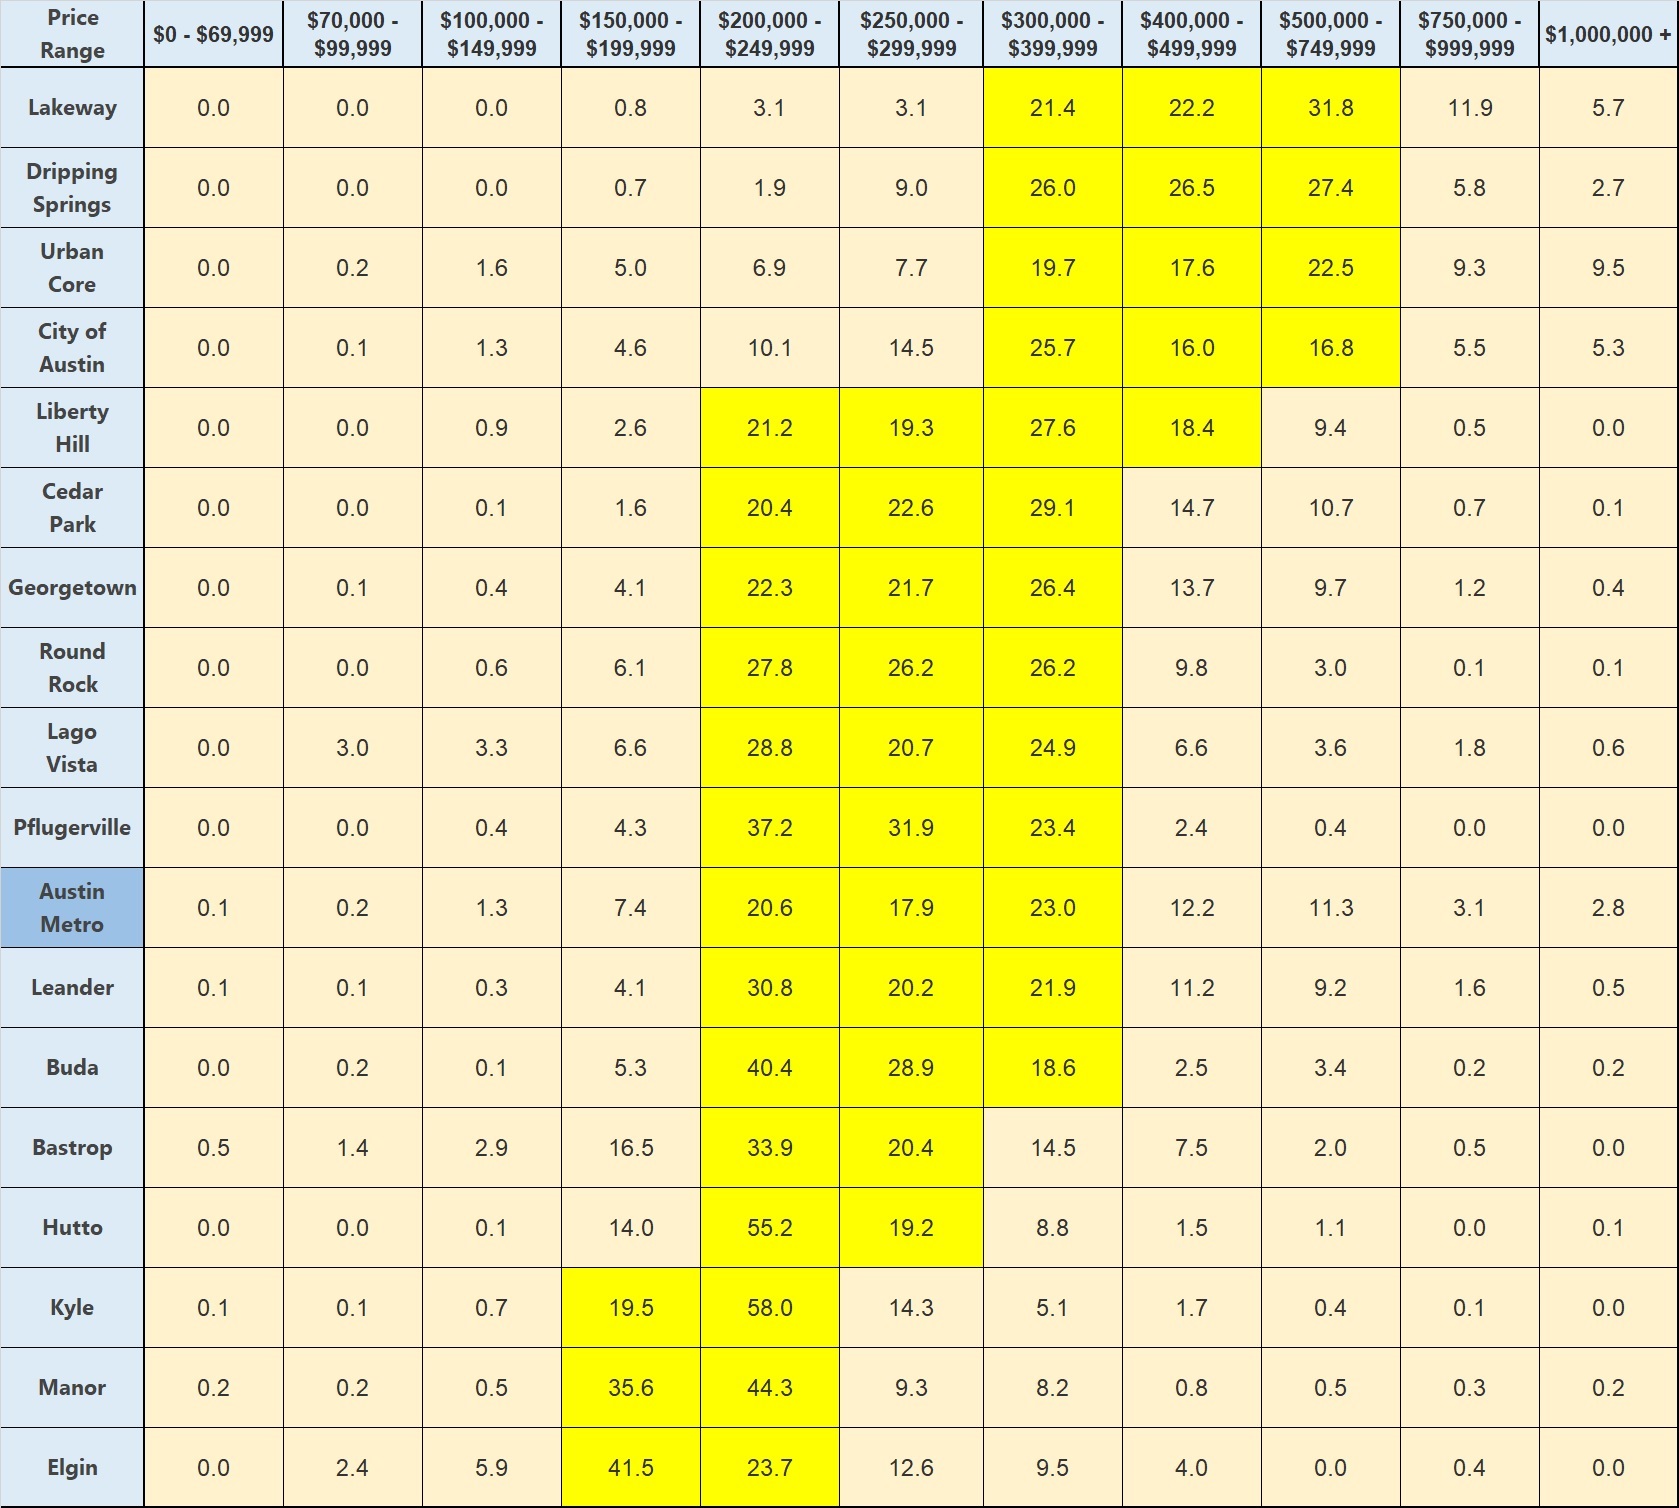
Obviously, there is very little activity in our area below $150,000, and almost none above $1,000,000 except in the Urban Core, Lakeway, and Dripping Springs. I have highlighted the most prevalent price ranges in each city, and you can see generally increasing home values moving right across the table. In 2018, 61% of homes sold across the metropolitan area were between $200,000 and $400,000, and about half of sales in Austin were in that range too. But notice that in the Urban Core that drops to 34%, and the largest share of sales in that very large part of the city was between $500,000 and $750,000.
I continue to believe we’ll see this distribution to creep toward the right in all of those cities this year, and I will update you as we go.

Discussion
Trackbacks/Pingbacks
Pingback: Housing affordability in the Austin area | Bill Morris on Austin Real Estate - May 28, 2019