It has been another very busy year in Austin-area real estate, and I haven’t made time for months to write about the market environment and outlook. This is the first of a few posts I hope to add over the next couple of weeks.
If you have followed my blog over the past several years, you know that I maintain a high-level “market dashboard,” to keep me in touch with broad market trends and to provide a larger context as I discuss with my clients the specific dynamics of the neighborhoods where they wish to sell or buy homes. With that background, I am pleased to report that our residential market continues to move quickly.
One metric that will help to differentiate the current market cycle from those of the past is the “odds of selling” – i.e., the percentage of active listings that sell each month. Here’s a look at that measure over the past 28 years:
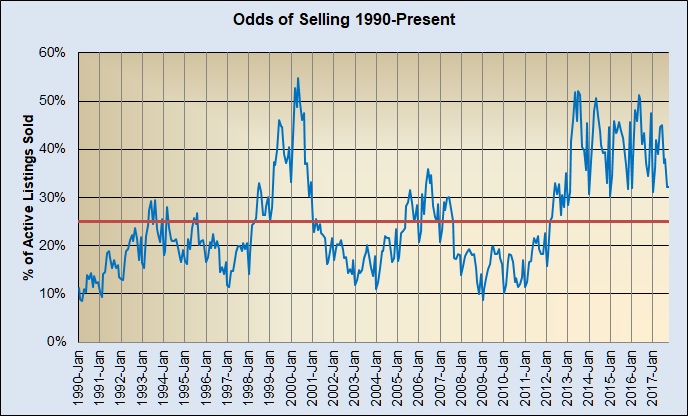
Note that the long-term average since January 1990 has been 25% of active listings selling each month. Notice, too, that that average has been affected dramatically by activity over the past six years. For most of the other 22 years shown on that chart, the “odds of selling” were significantly lower – frequently below 20%! I find this metric interesting, but a more complete look at supply and demand is important.
One of the best views of market vitality is shown in this Market Activity chart:

Market economists generally consider 6 to 6 ½ months of listing inventory to represent a “balanced” market, in which neither sellers nor buyers are generally favored by market conditions. There are enough homes on the market that buyers have alternatives, and enough buyers in the market that sellers can be choosy. Lower inventory levels tend to favor sellers and limit buyers’ choices, and the lower the inventory the more noticeable that market bias becomes.
Follow the dotted green line on the chart: We were down to about 2 months’ supply during the early part of 2000 (and, referring back to the first chart above, 50% or more of active listings sold in a few months during that same time). Inventory then climbed to near 7 ½ months’ supply in mid-2003 as we worked out of the market downturn resulting from the dot-com bust in 2001, then the 9/11 attack and the accounting scandals at Enron, Worldcom, Tyco, and others. (And the odds of selling dropped to below 20%.)
That market cycle was near its low from mid-2002 to early 2003, and the subsequent, fairly normal cycle lasted until the mortgage meltdown in 2007-2008. The Austin-area market weathered that storm much better than many other metro areas, and our recovery became noticeable in 2011, and very obvious in 2012. Note that that market bottom was longer and more chaotic than those before – discussion for another day. The most important feature of the current market cycle is that listing inventory has been at or below 3 months’ supply for virtually all of the past 5 years (and that the “odds of selling” have averaged about 40% for that period). This has been the longest-lasting “seller’s market” on record, at least for this area.
Throughout this long-term view, residential sale prices have fared well:
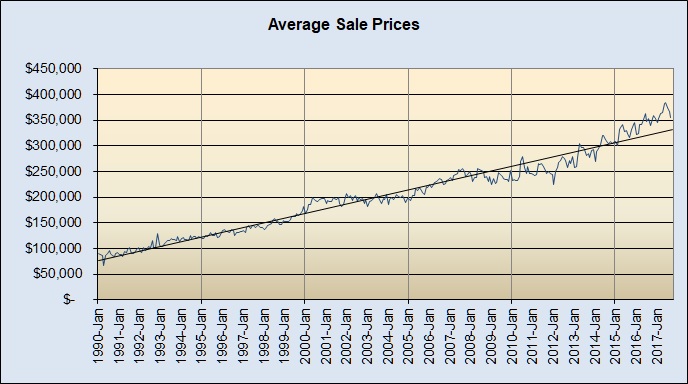
You can see that with a few months’ lag behind market lows, prices sagged below the long-term trend. You can also see that strong market times have lifted prices above that trend line – most noticeably since the beginning of 2015.
Demographic estimates still project strong job creation and population growth in and around the Austin metropolitan area in coming years. Home builders have gained some ground in new starts, but resale inventory remains constrained. That complicates moves for prospective home sellers who want to stay in the Austin area and keeps some from even entering the market, further limiting the availability of housing to support in-migration. It seems clear that that market environment will continue into 2018 (and longer?).
Obsolete land use policy, high permitting costs, and complicated processes in the city of Austin continue to exacerbate the housing supply vs. demand problem and to make housing in the city less affordable for many newcomers. At some point that issue itself may slow growth but in the meantime many (most?) new Austinites will be forced to the suburbs and beyond, so we can expect more sprawl for the foreseeable future, along with continued price appreciation throughout the area.
We may be seeing signs of this market cycle maturing, but short of a very significant economic event population growth and demand for housing show no signs of a real downturn. I’ll write more on that separately. For now, I’ll close by saying we can expect “more of the same” at least over the next six to twelve months, and probably longer.

Discussion
No comments yet.