Much has been said about the rising cost of housing in the Austin area, and it is a fact that market forces have driven prices upward in virtually all parts of the metro area over the past few years. I summarized those market conditions in my 2015 Market Summary. In this post and the next, I will narrow that focus a bit.
Market-wide price changes are the result of changes in the distribution of prices across many price ranges. Considering that point, and without focusing on details at this point, this graph is informative:
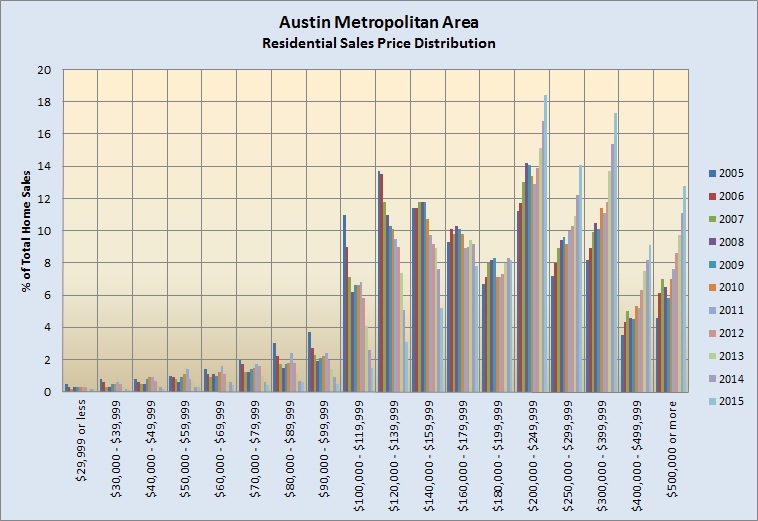
Notice that over the years covered, the percentage of homes sold in the price ranges from $100,000 to $159,999 has declined steadily. At the same time, the percentage of sales above $200,000 has increased dramatically. The proportion of sales between $160,000 and $179,999 is down but not as steeply as lower priced homes, and the $180,000 to $199,999 range has changed very little. Many prospective homebuyers in Central Texas may be surprised that buying a home for less than $200,000 is still entirely possible here.
Now, for those like me who enjoy the details, the table below will be interesting. (If you’re happy with the big picture the graph above shows, then feel free to skip to my next post, So how much does housing cost … Part 2.)
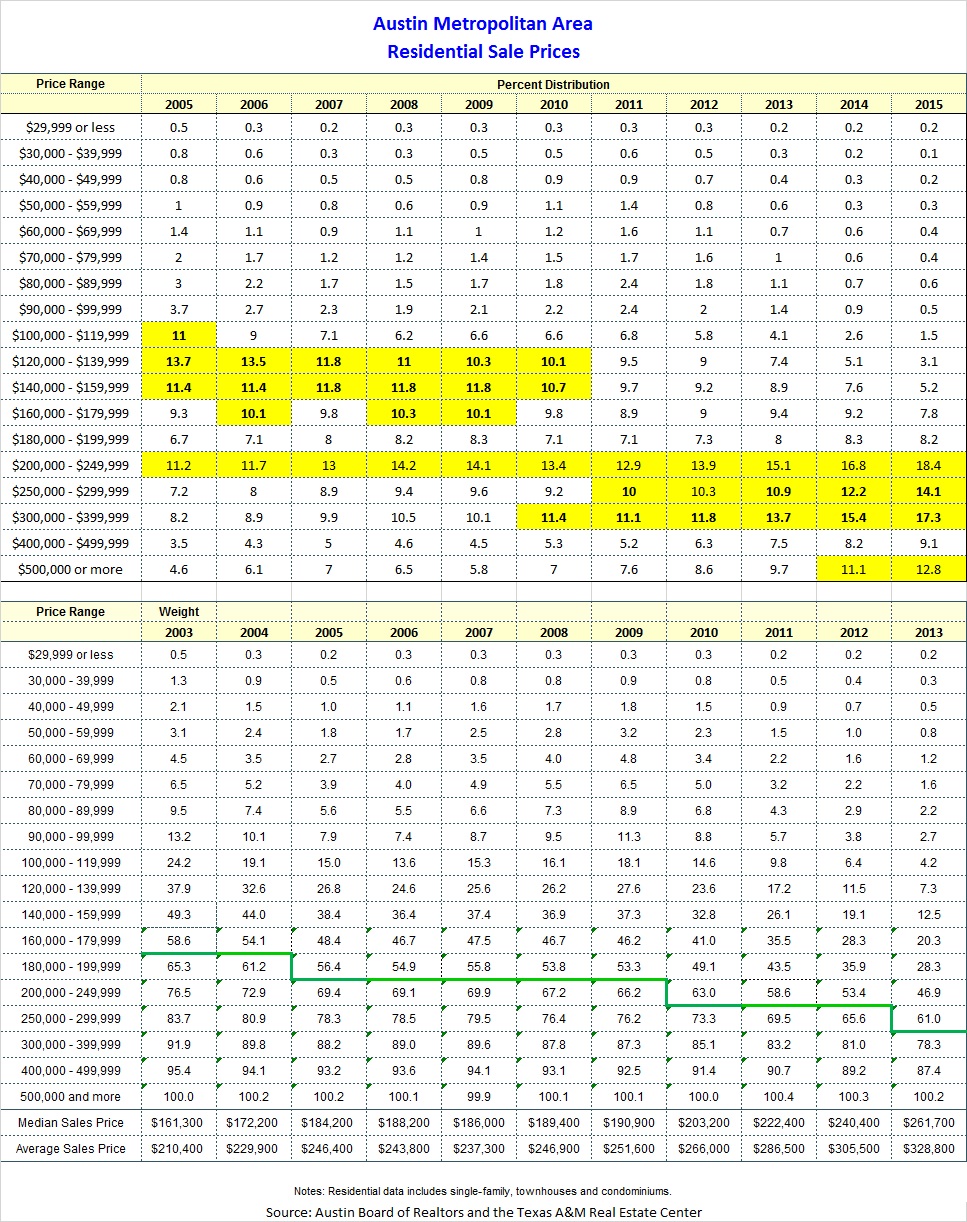
The top half of the table shows the percentage of sales each year in the price ranges used on the graph. I have highlighted the ranges in each year that represented 10% or more of the year’s sales. Notice that since 2011 all of those highlights are above $200,000.
The bottom half of the table just shows the cumulative percentages of sales as you move from lower to higher prices. The green line shows the price range where you would have to shop to see at least 50% of all the homes sold in each year. (I.e., the median price for the metro area is in the price range just above the green line.)
Again, some home shoppers will be surprised that more than 1/4 of sales in 2015 were below $200,000, and almost half were below $250,000!
The obvious question is, “Where are those houses?” My next post will provide some answers.

Discussion
Trackbacks/Pingbacks
Pingback: So how much does housing cost in Austin? (Part 2) | Bill Morris on Austin Real Estate - February 22, 2016
Pingback: Affordability in Austin’s “urban core” | Bill Morris on Austin Real Estate - March 15, 2016