The real world of our fast-paced real estate market in Austin makes this post a couple of weeks later than I planned, but following up on my recent summary of Angelou Economics view of our community, I want to add a quick look at the residential market specifically.
If you have attention to local media over the past couple of years, it won’t surprise you that we have had a significant mismatch between housing supply and demand, and that as a result prices have been rising. Here are some details to put headline in perspective:
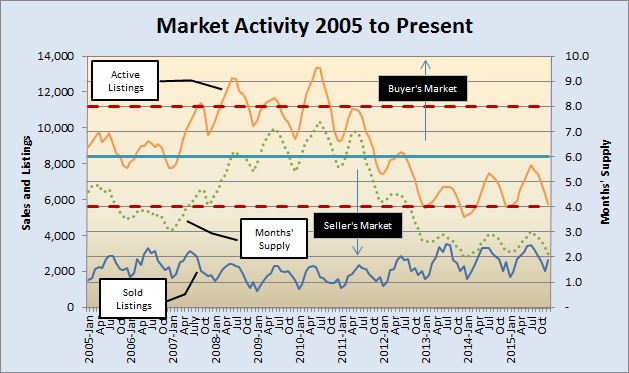
The short explanation of that chart is that Active Listings divided by Sold Listings gives us the Months’ Supply of residential properties. (Data from the Real Estate Center at Texas A&M University.) Most analysts consider 6 to 6 1/2 months of inventory to represent a “balanced” market. The farther conditions get from that balance, the more advantage either buyers or sellers have in establishing the price and terms of successful sales.
Notice that the Austin metro market have been below 6 months of inventory since August 2011, and at or below 3 months of inventory since December 2012. Also notice that the number of active listings has been trending upward during that 3-year period (given seasonal fluctuations). The number of prospective buyers for that inventory has simply been rising more quickly. As a result, sellers have been able to demand higher and higher prices:
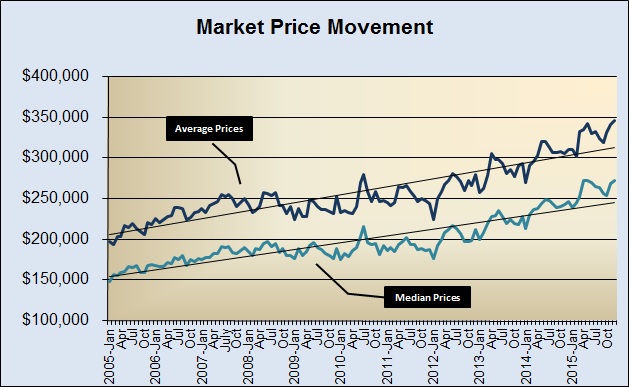
You can see that in 2015, both average and median sale prices were well above the 10-year trendline.
Using 12-month rolling averages smoothes that data for a better look at trends:
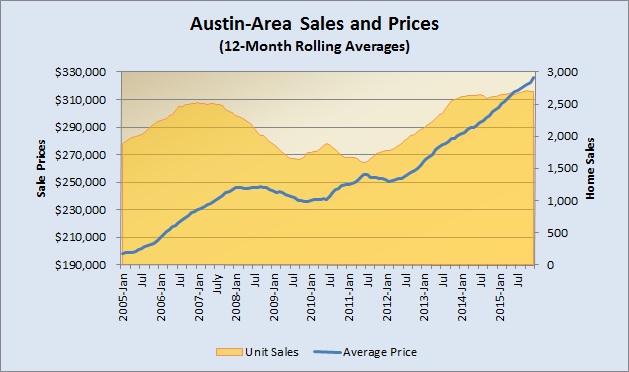
The rolling average unit volume (number of houses, condos, and townhouses sold) essentially flattened in late 2013. That number was largely constrained by the number of properties for sale. So far, though, the market has not exerted much constraint on the average price. (As an aside, note how little effect the housing downturn in 2008-2011 had on prices in Central Texas. That’s another discussion, but worth being aware of.)
Finally, I like to use the “odds of selling” as shorthand for market absorption. This chart shows that during three months in mid-2013, and in May 2014, more that half of the active listings sold:

Seasonal peaks in this metric have pretty consistently been in the Spring and Summer, as you would expect. An interesting observation about 2015 is that we saw higher-than-normal absorption — 46% — three times — in March, June, and December. We’re a couple of weeks from having final reports for January 2016, but based on raw MLS data I believe we’ll see a fairly typical winter dip on the way to another very busy year of residential sales throughout the Austin/Central Texas market.
Could conditions change? Certainly. But the demand for housing in the Austin area is being driven by job growth, and economists including Angelos Angelou, Mark Sprague, Eldon Rude, Brian Kelsey, and the Dallas Fed believe that will continue at least through 2016.
Let’s talk about what these conditions mean for your plans to sell or buy your home or investment properties.

Discussion
Trackbacks/Pingbacks
Pingback: So how much does housing cost in Austin? (Part 1) | Bill Morris on Austin Real Estate - February 22, 2016