Residential market activity in the Austin metropolitan area is up. As of June 29, 2011, here is a high-level look at our residential market:
1,681 Sold in the past 30 days
At that pace, existing inventory will last about 5.6 months, compared with 6.5 months that most analysts consider a “balanced” market. This is really a minor difference. The characteristics of a strong Buyer’s Market really become noticeable at about 8 months’ inventory. A true Seller’s Market becomes recognizable at about 4 months’ supply. The Austin market remains highly variable, with some neighborhoods that are dramatically over-supplied, with slow sales and weak values, while other nearby areas are selling very quickly and with rising prices.
Average time on market for homes that sold in the past month was 69 days, and sale prices averaged 97% of list price. In the aggregate, Austin/Central Texas remains a healthy market for residential real estate.
Even more encouraging, there are 2,954 Pending contracts today, about 1.8 times the recent pace of sales. That indicates at least a small uptick in demand over the past 45 days or so.
(Note: Figures above are “raw” MLS data only. After the month closes, final data may differ. All other information included in this report are from the Real Estate Center at Texas A&M University.)
I discussed the number of pending sales more extensively earlier this week in Signs of Austin-area market progress. For now, I’ll just summarize that the number and percentage of pending contracts at the end of May were very near the 10-year average and near pre-recession levels. Moreover, that level was reached this year without the distortion of temporary tax incentives for home purchases.
Looking back at final data for May, there are other encouraging signs. First, the “odds of selling” that I have tracked for years was at a 2-year high:

I have pointed out before that in every market cycle since1990, an absorption rate of about 10% signaled a coming upturn. In the worst of those cycles (1990-1991 and 2003-2004), the odds of selling dipped to that level twice before a genuine growth cycle began. This time, we have dipped three times — in January 2009, January 2010, and January 2011. Volatility is probably not entirely behind us, but as I mentioned above market performance this year has not been influenced or distorted by artificial incentives. We are about three weeks away from having final June 2011 data, but I am eager to see if it confirms this growth trend.
It is also encouraging to see continuing strength in home values:
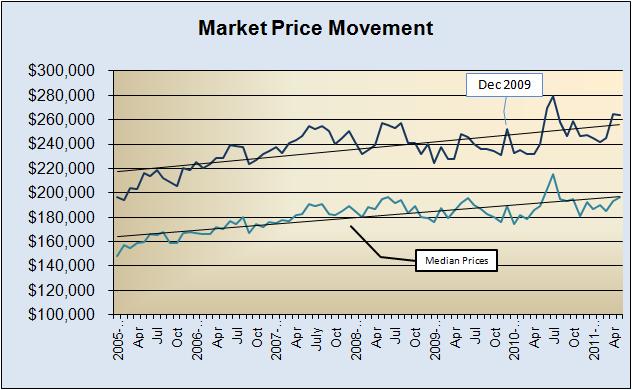
The average sale price in May 2011 dipped 0.4% from the previous month, but was up a respectable 10% compared to May 2010. The median price was up 1.9% month-to-month and rose 4% from a year earlier.
The 12-month average filters out most seasonal effects:

Even though unit sales remain well below peak volume, the 12-month average sale price reached another all-time high in May.
Referring back to the Market Price Movement chart above, notice that the year-long average still includes a significant spike in July 2010. That was the month after the last homebuyer tax credit program ended and was the result of most entry-level buyers completing their purchases in June, leaving more expensive move-up purchases to dominate the average in July. Next month’s 12-month average will be the last to include that spike, so I expect to see a dip in the rolling average in July 2011. If we really are entering a new growth phase, though, we should see the upward trend resume the following month.
I am always available to answer questions about this information, or about specific homes or neighborhoods. Feel free to call or text or email me, or just complete the easy form below and I will follow up with you promptly.

Discussion
No comments yet.