Market conditions for residential properties in the Austin/Central Texas area continue improve, and remain better than reports in the national media and far better than conditions in the metro markets that suffered most during the housing downturn over the past few years.
This recent article highlights an important point of reference:
I will update my Austin Market Dashboard shortly, but the highlight in that Austin American-Statesman piece is the emphasis on the number of pending contracts for single family homes at the end of May 2011 — up 53% from May 2010.
My readers know that I am skeptical of virtually all single-point comparisons as indicators of market change. Pending contracts are important as the most current measure of demand, and this is a statistic that is worth following. Historical perspective almost always helps, though. With that in mind, here is a look at ten years of pending sales data:
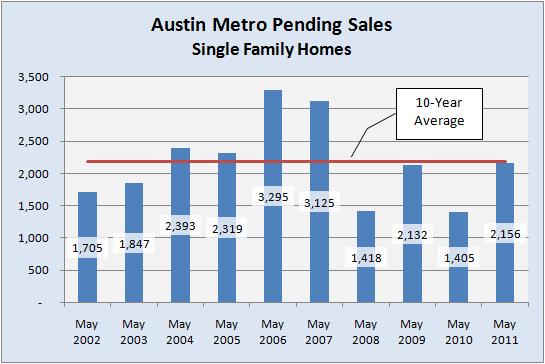
With that view, the year-to-year growth mentioned in the Statesman article is visible. So is an almost equivalent tumble in the previous twelve months. This looks very much like a repeat of the pending contract counts we saw in 2008-2009.
What I find most encouraging about this data for May 2011 is that we’re back again to very near the 10-year average, and only slightly below our market’s pre-bubble performance in 2004 and 2005. We saw this kind of surge in 2009, but this year it was unassisted and undistorted by tax incentives for home buyers. This time should be more representative of “real” market conditions.
Even more important than the absolute number of pending sales is how that volume relates to total supply — i.e., Pending contracts as a percentage of Active listings.
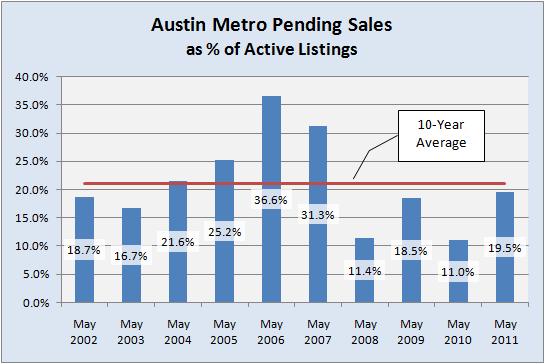
The shape of year-to-year changes in this view matches the first chart closely except that you can see demand relative to supply was a little inflated in 2005. Still, though, demand as measured by Pendings at 19.5% last month compares well to the 19% absorption rate using sales actually closed in May 2011. More on that on the dashboard later.
It is certainly true that closed sales were down from May 2010 to May 2011, but the most immediate measure of market demand clearly shows improvement. Anecdotally, my business and that of most real estate professionals that I talk to indicate that the pace of market activity is up, and there is plenty of support in local economic reports to expect that we really are on the way to more consistent growth.

Discussion
Trackbacks/Pingbacks
Pingback: Austin-area building permits — signs of confidence? « Bill Morris on Austin Real Estate - July 7, 2011