Final data for April has been in for a few days so it is time for an update. First, here is a snapshot of the Austin Metro residential market as of May 27, 2011:

The important point here is the market absorption rate: With sales of 1,682 properties in the past thirty days, today’s listing inventory represents about 5.5 months’ supply — healthy conditions, with demand slightly outpacing supply, but not significantly favoring either buyers or sellers. As I have pointed out previously, conditions vary widely from market segment to market segment, but this overall average is useful.
Putting that metric into a long-term context, 5.5 months’ supply is very near the 5.3 month average over the past 21-plus years:

As I have discussed before, this market cycle more than any other in the past two decades is characterized by volatility. In the past, when the market “bottomed” once or twice at or near a 10% absorption rate — and always in January-February — we saw a new growth cycle begin. This time we have seen three dips to near that 10% level, with a lot of zigging and zagging along the way:

Zooming in on just the current market cycle, it is clear that we have seen January-to-April surges for three consecutive years:
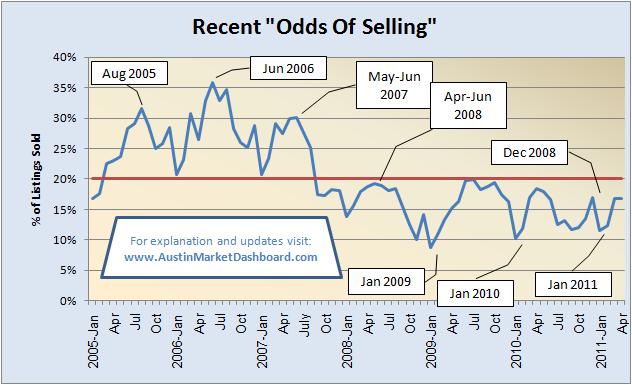
Is the trend sustainable this time? With strength in Austin job and population growth, there is certainly reason to think the answer is “yes.” The Austin area remains in an extremely enviable position compared to many other large U.S. cities, but calling the 17% “odds of selling” in March-April a clear signal of ongoing market growth would be going too far. A strong Spring selling season, with May and June still in that 17% range or better, will be a more meaningful indicator. The good news in the market snapshot at the top of this post is that housing inventory is down relative to demand, and the number of pending listings indicates that demand is up compared to a month ago.
That said, the most remarkable indication of long-term market strength remains the clear direction of market values:

The jump from March to April 2011 is impressive, but the growth in average sale price since January 2011 is a better reason for confidence. More importantly, the 12-month rolling average of sale prices continues to climb, reaching yet another all-time high in April 2011, even as sales volume remains weak:
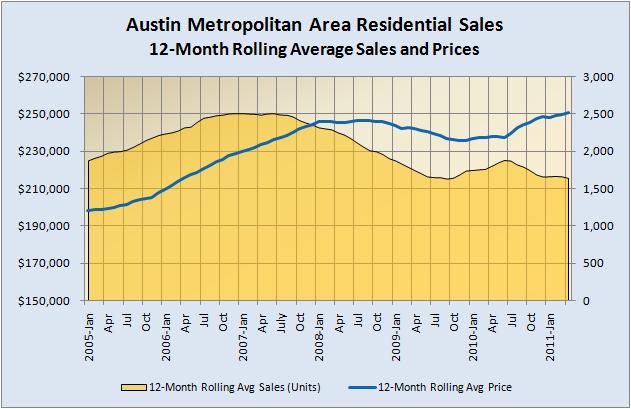
Just as the May-June market absorption rate will tell us whether we have a real trend instead of a seasonal surge, the same is true in gauging the rolling average price: Our highest-ever single month average price was in July 2010, the month after the last homebuyer tax credit program ended. If the rolling average price continues to increase over the next two months, then clearly when July 2010 rolls out of the average we will have a full year of market appreciation, undistorted by temporary incentives.
Virtually all economic indicators call for optimism for Austin’s economy and housing sector. However, uncertainty in the U.S. economy generally, and in the real estate business in many key metros, call for caution. Personally, I remain bullish but I am eager to see actual results in May and June 2011 before saying confidently that we have entered a sustainable new growth cycle.
If you are interested in more on this dashboard approach to the Austin market, the links below will display printable PDFs of the charts above, and more:

Buy Online
http://www.citysanowmake.us.tf
Posted by Buy Online | June 10, 2011, 6:12 AM