Yesterday I posted several articles to AustinMarketInfo.com, on of which included a link to an older piece that I reviewed today:
BusinessWeek, January 2, 2010)
That article included a list of “Biggest Metros With the Best Long-Term Real Estate,” selected from the largest 25 U.S. metropolitan areas. Discussion of each city stated the change in home prices from 1990 to 2010, which I summarized in this graph:
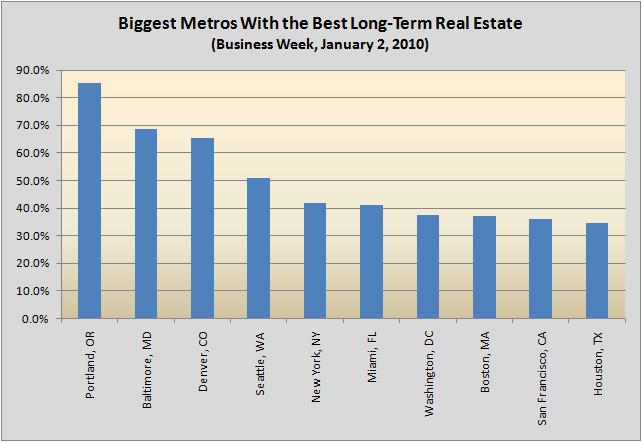
I have pointed out many times that even in the cities that were hardest hit by the housing downturn in recent years, long-term homeowners have still done reasonably well. (And it doesn’t require this 20-year holding period. In virtually all of those cities, property owners who purchased before 2004 still have homes that are worth more than they paid.)
Austin is not one of the 25 largest metros so it was not included in BW’s ranking. I could not duplicate BW’s calculations using the average price data that I have for Austin, so rather than try to guess what adjustments may or may not have been used for inflation, etc., I returned to the Case-Shiller Home Price Index that I refer to frequently. Houston and Baltimore are not used in the Case-Shiller calculations, so I have compared Austin only to the other eight metros:
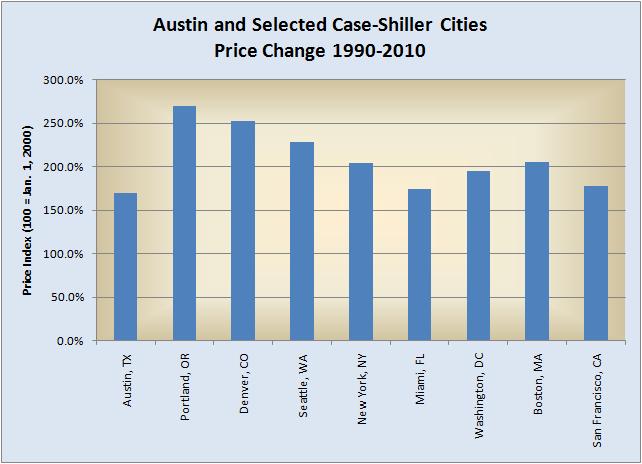
In that chart, 100% represents year 2000 as the reference point for all 9 cities. The percentage change figures do not match those reported in the BusinessWeek article, but they are consistently calculated among themselves, and the rankings are very nearly the same as in the BW piece.
By this comparison, Austin’s gain in market value looks very tame compared with most of the other cities. It’s still nothing to sniff at, though: 170% price appreciation in 20 years represents an average of 8.5% annual growth. I challenge you to find any place else the average American could have “stored” their money during that period that would have performed as well. Then, consider the financial leverage that most homeowners enjoy, and the actual cash-on-cash return would have been nothing short of phenomenal if the home were sold at the end of that period.
But what did market behavior in all those cities look like along the way? Very different:

Again, this data is “zero’d” in 2000. Austin is the black line so it is relatively easy to pick out. So are Miami (in orange) and Washington, DC (in blue) — the highest peaks in 2006-07. It’s true that other cities have gained more value than Austin from 1990 to present, but this is a situation in which “slow and steady” seems far preferable to me. I have not been through a time when I could have doubled the price of my house in 2 or 3 years, but I haven’t ever seen my home value fall by 50% or more either. Among these cities, only Denver experienced a similarly “sane” growth profile.
Call me boring, but I really prefer being highlighted in another article I posted yesterday: CitiesUnaffected by a Bad Economy.

Major thanks for the article post. Will read on…
Posted by Ella | May 21, 2011, 5:24 PM