I have updated my Austin Market Dashboard with final data through March 2011. This post is a short version, but you’ll find more detail and discussion on my website (linked above).
Residential market activity in the Austin metropolitan area is up. As of April 28, 2011, here is a high-level look at our residential market:
1,473 homes Sold in the past 30 days
At that pace, existing inventory will last about 6.8 months, compared with 6.5 months that most analysts consider a “balanced” market. This is really a minor difference. The characteristics of a strong Buyer’s Market really become noticeable at about 8 months’ inventory. A true Seller’s Market becomes recognizable at about 4 months’ supply. The Austin market remains highly variable, with some neighborhoods that are dramatically over-supplied, with slow sales and weak values, while other nearby areas are selling very quickly and with rising prices.
Average time on market for homes that sold in the past month was 84 days, and sale prices averaged 97.6% of list price. In the aggregate, Austin/Central Texas remains a healthy market for residential real estate.
Even more encouraging, there are 2,801 Pending contracts today, almost twice the 30-day sales number!
(Note: Figures above are “raw” MLS data only, and include only single family homes. After the month closes, final data may differ. All other information included in this report are from the Real Estate Center at Texas A&M University and covers a broader range of residential property types.)
Those market conditions are important. Other parts of the U.S. — notably, California, Arizona, Nevada, and Florida, but others as well — have seen housing inventories that represent 12 months’ supply or more, and whole cities have seen heavily discounted foreclosed properties represent huge percentages of total home sales (see Foreclosure impact in Austin, 02/24/11 and More about foreclosure/short sale impact in Austin, 04/14/11). The result of those conditions has meant losses of 50% in residential market values in some places.
This chart makes it clear that Austin and Central Texas have fared much better:
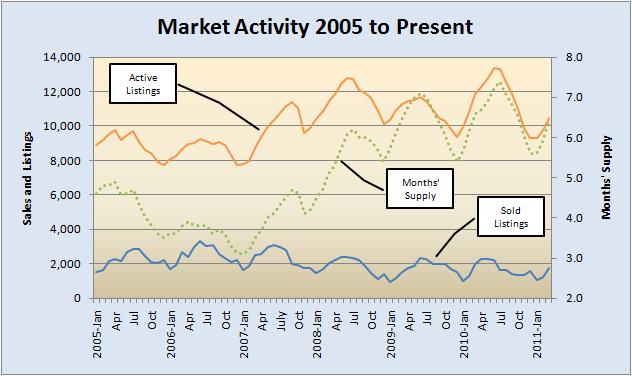
Listing inventory obviously grew during this time, but it peaked at 7.4 months’ supply in July 2010, just after the last homebuyer tax incentive ended. Now we are back to about 6.5 months of inventory — healthy conditions.
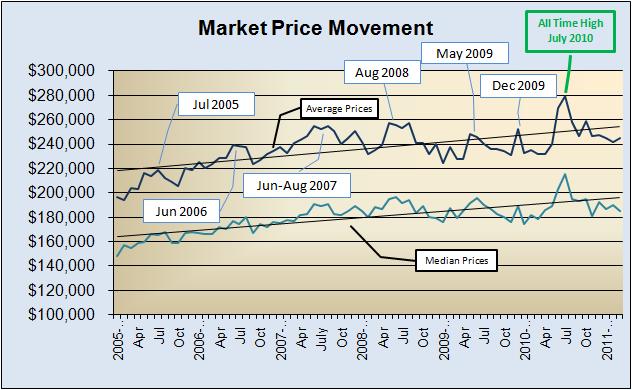
The trend for property values here is still upward, and the average residential sale price in the Austin metropolitan area actually peaked — an all-time high — in July 2010. That is largely a distortion caused by the same tax credit program that led to last July’s inventory build-up: Tax incentives of up to $8,000 for home purchases significantly influenced sales up to the market median price and a little higher — up to, say, $220,000. On July 1, 2010, that incentive was no longer a factor, so July’s sales were more heavily dominated by higher-priced properties. Even with the votility of the past four years, though, our average and median sale prices in March 2011 were down only slightly (3.8% and 3.1%, respectively) from the pre-recession highs:
The key “unknown” at this point is whether we have more volatility ahead. Locally and regionally, conditions remain good, but without a broader recovery in the national economy and housing sector, continued strong in-migration and the ability of those new Austinites to buy homes is more limited than it should be. Over the past twenty years, market “bottoms” were signaled when we reached lows about about 10% of active listings selling in month. In 1990-91 and again 2003-04, our market reached that level twice before entering strong growth cycles:
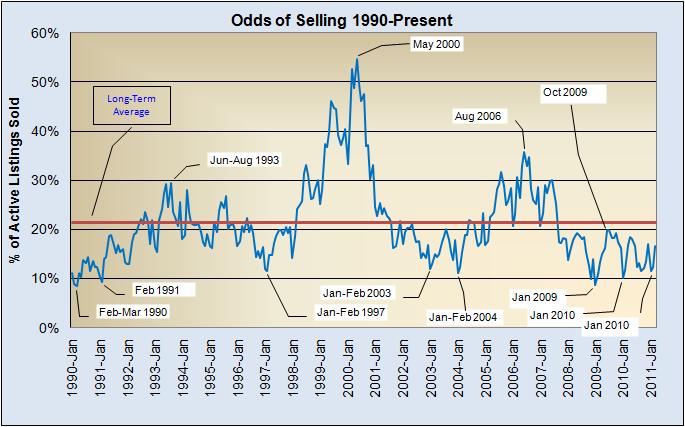
This time is different:
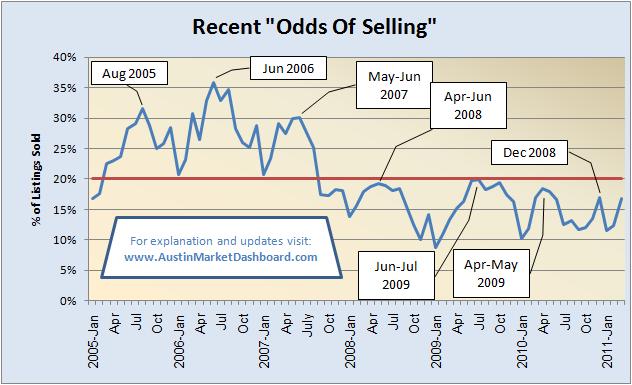
Along with three peaks near the long term average of 20% “odds of selling,” we have also see three lows at or near 10%. Recently, this measure of the market has shown strength, but much depends on outside forces. There are a number of good signs for the national economy in recent months, and normal seasonal activity would indicate that we should expect at least several months of good performance. We’ll just have to wait and see at this point, and I’ll keep reporting.

Howdy blogger, thank you for providing this article.. I found it first-class.
Posted by Sophie | May 21, 2011, 5:24 PM