There are many ways to evaluate income-producing properties — cash flow, cash-on-cash return, equity rate of return, net present value analysis or internal rate of return, and others. They all have their place in investment analysis and comparison, and investors usually have at least one favorite that they require.
One of the simplest measures that I find useful as a blunt instrument for property comparison is the Gross Rent Multiplier — simply the purchase price of a property divided by annualized gross rental income. It can be refined somewhat with assumptions about expected vacancies, but for a “30,000-foot view” of investment properties in Austin I simply defined a “typical” residential rental property as 1,200 to 1,500 square feet with 3 bedrooms and 2 baths and assumed 100% occupancy — unrealistic but held constant for all areas. The data shows the total number of homes like that that were sold in 2010, and the total number leased in 2010. Here’s how that hypothetical rental compares from one part of Austin to another:
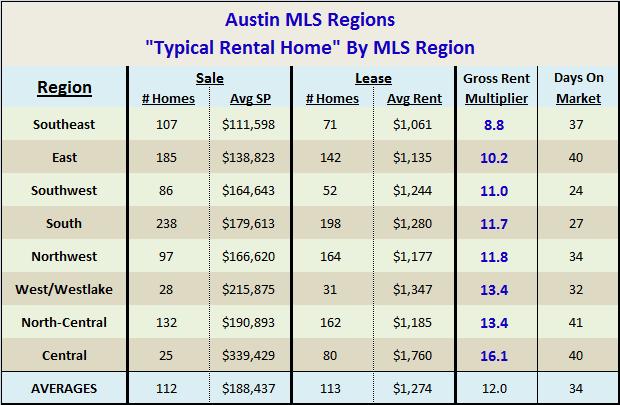
Keep in mind that the availability of houses that meet that description varies widely among MLS Regions. As you saw in a previous post (What can you get for your money in Austin?), the average size of a single family home in West Austin is closer to 3,200 square feet. Smaller homes are common in North-Central and East Austin, however. Even smaller homes are common in Central Austin but at substantially higher prices than in East and Southeast Austin. Likewise, condominiums and townhouses are almost completely unavailable on some parts of the city, but a substantial portion of the market elsewhere. On the other hand, there are areas where the residential rental market is dominated by multifamily properties (duplex, triplex, fourplex), and others where those are almost nonexistent.
The point of this table is simply to compare the potential rental income for this normalized property description to its average sale price in each area. The GRM shown for each region is nothing more than a yardstick to help focus on the relative performance of rental properties around town. This is a one-dimensional analysis: There are differences among locations in terms of tenant stability, likelihood of property damage either caused maliciously or through neglect, the amount of time and effort property management will require, or just the kind of tenant (income level, education, profession, etc.) that a particular property/location will attract, and investors must make their own decisions about the importance of those factors and others.
That said, the table above ranks the eight MLS Regions purely on this “typical” property’s ability to generate rental income for a given level of investment, with Gross Rent Multipliers that range from 8.8 to 16.1. There should be something for almost any investor in that mix.

Discussion
Trackbacks/Pingbacks
Pingback: Tweets that mention Where to invest in Austin real estate? « Bill Morris' Austin Real Estate Blog -- Topsy.com - February 4, 2011
Pingback: Where to invest in Austin real estate? « Bill Morris' Austin Real … | Market My Home Local - February 4, 2011
Pingback: Rental Property Investment Resources - March 16, 2011