I have commented recently on the strength of property values in the Austin/Central Texas market. Here’s another look at that data (through November 2010):
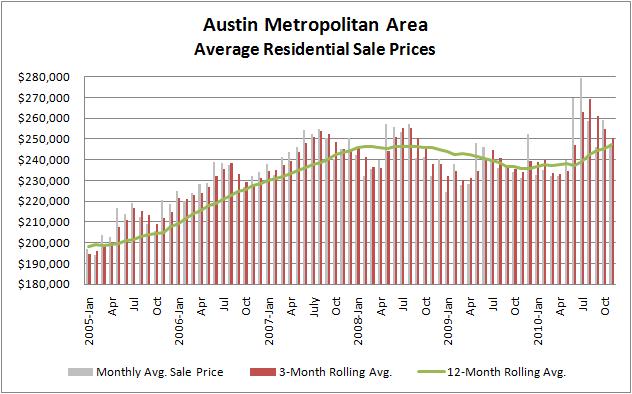
Seasonality is apparent in the Monthly Average and 3-Month Rolling Average price bars, so it is clear that average price increases during Spring and Summer, followed by declining prices in the September to November period are not unique to 2010. Obviously, the homebuyer tax credit program that expired at the end of June 2010 greatly exaggerated the changes during the 2nd quarter of 2010. Recent news reports have highlighted the month-to-month average price erosion over the past couple of months, but notice the earlier peak that recent months are compared to.
To me, the really interesting feature of this graph is the 12-Month Rolling Average. That line filters out the seasonality and allows us to see longer term trends. That line has been basically flat or heading upward for 13 months, since October 2009. Moreover, in November 2010 the 12-Month Rolling Average Sale Price was at an all-time high! I haven’t seen that reported anywhere else.
Now, before jumping to the conclusion that boom time is here again, note that this is not because of general increases in the value of specific property types or market segments, although we did see that happen from 2005 to 2007 and early 2008. More recently, the market average price has been influenced more by a shift in the percentage of sales toward higher price ranges. I have made that comment before, but for a more detailed look this table is helpful:
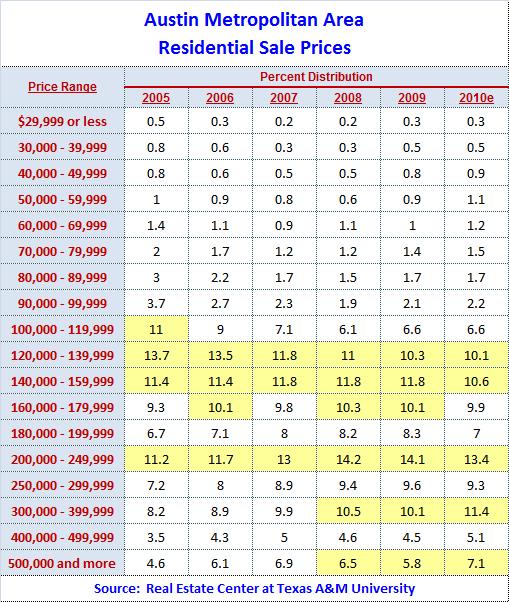
I have highlighted price ranges in each year that represented 10% or more of total sales in that year. Notice the steady decline in the $100,000 to $140,000 segments. Also, look at the increases in the $200,000-$250,000 (up 33% since 2005) and $300,000-$400,000 (up 45%) price ranges, and the even more impressive growth in the over-$500,000 segment — up more than 50% from 2005 to 2010!
While individual Austin-area homeowners have not generally seen their property values increase since the housing downturn and mortgage crisis began, a larger percentage of homebuyers have moved into much higher price ranges. That’s a real testament to the underlying strength of the Austin economy, continuing to create jobs locally and to attract corporate relocations while holding wages up — a very different experience than the areas that have featured so prominently in national news.
As always, my Austin Market Dashboard is updated monthly with graphs and commentary about the state of our real estate market. I will have final November results incorporated there just after Christmas.

Bill that is a great chart. I’d like to see it done for zips where prices are high so you can adjust for the shift to higher priced homes. I’d also like to see number of sales plotted next to the data.
Posted by Mr Bubble | December 30, 2010, 11:17 PM