From RISMedia today:
Forgive a quick editorial comment: Doesn’t the word “ease” sound like improvement in a situation that needed to improve? Obviously, the headline means that pending home sales are “down.” I don’t know anybody who considers that good news, but as always I want to provide the Austin/Central Texas view of this news. (Yes, pendings have “eased” here, too.)
The article points out that “The Pending Home Sales Index, a forward-looking indicator, declined 2.6% to 75.7 based on contracts signed in June 2010 from an upwardly revised level of 77.7 in May, and is 18.6% below June 2009 when it was 93.0.” I won’t try to recreate the PHSI calculations here, but I have compiled the number of new residential sales contracts signed in the Austin Metro Area in each month since 2005. More on that shortly, but for now consider this comparison: there were 18.6% more contracts signed in Austin in June 2010 than in May 2010, but June 2010 was down 20.1% from June 2009. New contract volume in Austin increased again in July, but was still down 13.2% compared to last year. RISMedia does not yet report on July data, but I pulled this information from the Austin/Central Texas MLS so it is as current as I can retrieve at this point.
Here is a summary of monthly contract executions (not closings) over the past 5 1/2 years:
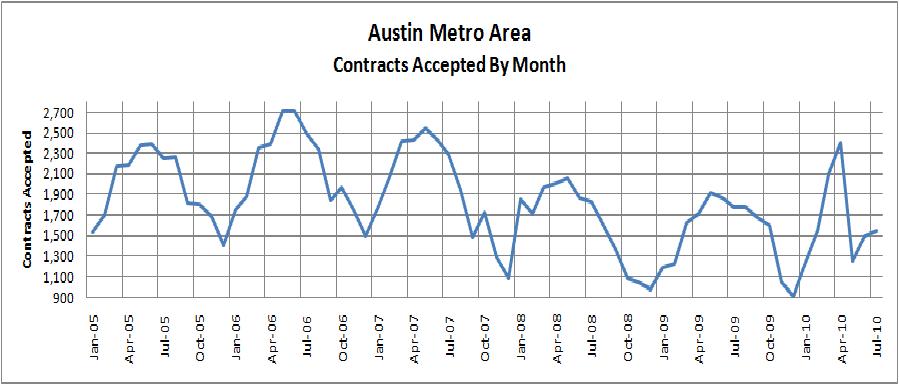
Clearly the trend has been downward since the market peak in 2006. Seasonal patterns are generally visible, but distortions caused by tax incentives for homebuyers are apparent. Note the steep drop from October 2009 to December 2009, the incredible spike from December 2009 to April 2010, and the jaw-dropping crash from April 2010 to May 2010. Those events coincided with the requirements of tax credit programs that ended in November 2009 and April 2010. (The first program required contracts and closings to be completed by November 30, 2009 so new contracting activity slowed earlier.)
Here is another view of the same data which allows easier year-to-year comparisons:
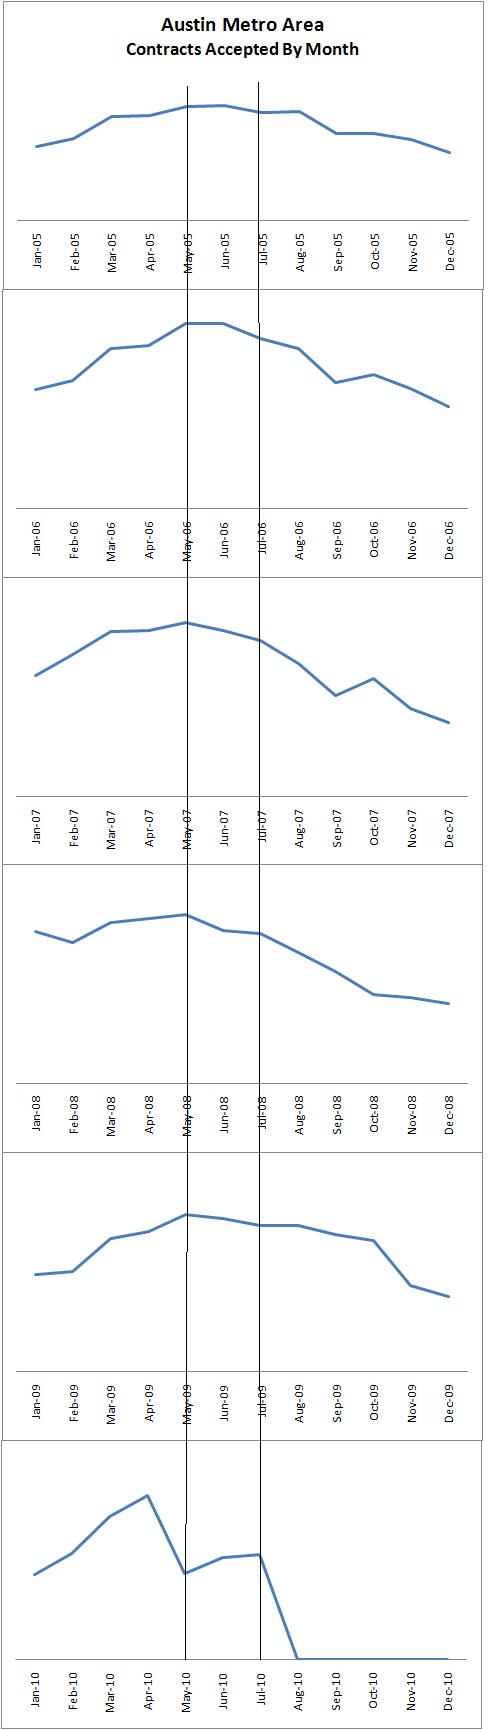
I have added vertical lines through May and July to make it easier to see a couple of unique features of Austin’s 2010 pattern. Again, the number of new contracts signed plummeted from April to May 2010. The year’s peak month moved forward in response to tax incentives. In every year from 2005 through 2009, new contract volume declined in June and July. Not so this year. I am tempted to call that encouraging, but two months do not establish a trend. Obviously, we have no August data to analyze yet for this year, so this will require follow up, but it appears that “left over” demand after the last tax credit program may still make itself known.
Nobody was surprised that the tax credit programs accelerated home purchases. That was their purpose. In the cities and states that have suffered the worst of the housing downturn and recession, that activity was undoubtedly welcome. Nonetheless, I have been against these programs since the first rumors surfaced last year because I do not want the real estate business to become dependent on an ongoing stream of “special incentives,” a la the automobile industry. Moreover, in Austin and most of the U.S. the distortion of seasonal demand was unnecessary and, I argue, detrimental to the health of local real estate markets.
We still don’t know how much the impact of those incentive programs will depress homebuyer demand in the coming months, but it is encouraging to see new contracts still being signed here. We’re still below the same time last year and we are seeing a VERY weak summer “selling season,” but we have actually seen increases in contracting activity so far this summer that did not happen in any of the previous five years. It is also worth noting that year-to-date activity is up 2.4% over last year:
| Jan-Jul |
YTD
Contracts
Signed
|
| 2005 | 14,619 |
| 2006 | 16,286 |
| 2007 | 15,957 |
| 2008 | 13,301 |
| 2009 | 11,302 |
| 2010 | 11,577 |
Yes, this year’s peak happened in April instead of May, but we may be seeing signs of a coming rebound.
More on this in the future ….

Discussion
No comments yet.