Preparation, staging, marketing, follow-up, sales, negotiation…. There are many things that an experienced real estate professional can and should do when representing a home seller.
Comprehensive market analysis and pricing consultation are a vital part of those services. What a Realtor® cannot be expected to do is work miracles — i.e., sell property for more than it’s worth. Of course, any product is worth nothing more or less than what a willing buyer and a willing seller agree to, but recent market activity and the current competitive environment paint a clear picture of the relevant price range for your house.
“Can’t we just try it a little higher?”
“Of course you can. When did you say you needed to move?”
So what is the likely result of testing a higher price? To provide a meaningful example, I reviewed sales of single family homes in the Austin metropolitan area for all of 2010. The median sale price was $195,000. I worked with a price range that straddled that figure by a little more than +/- 10% — from $170,000 to $220,000. That price range represented about 17.5% of all home sales last year. Here is a scattergram view of all of those sales:
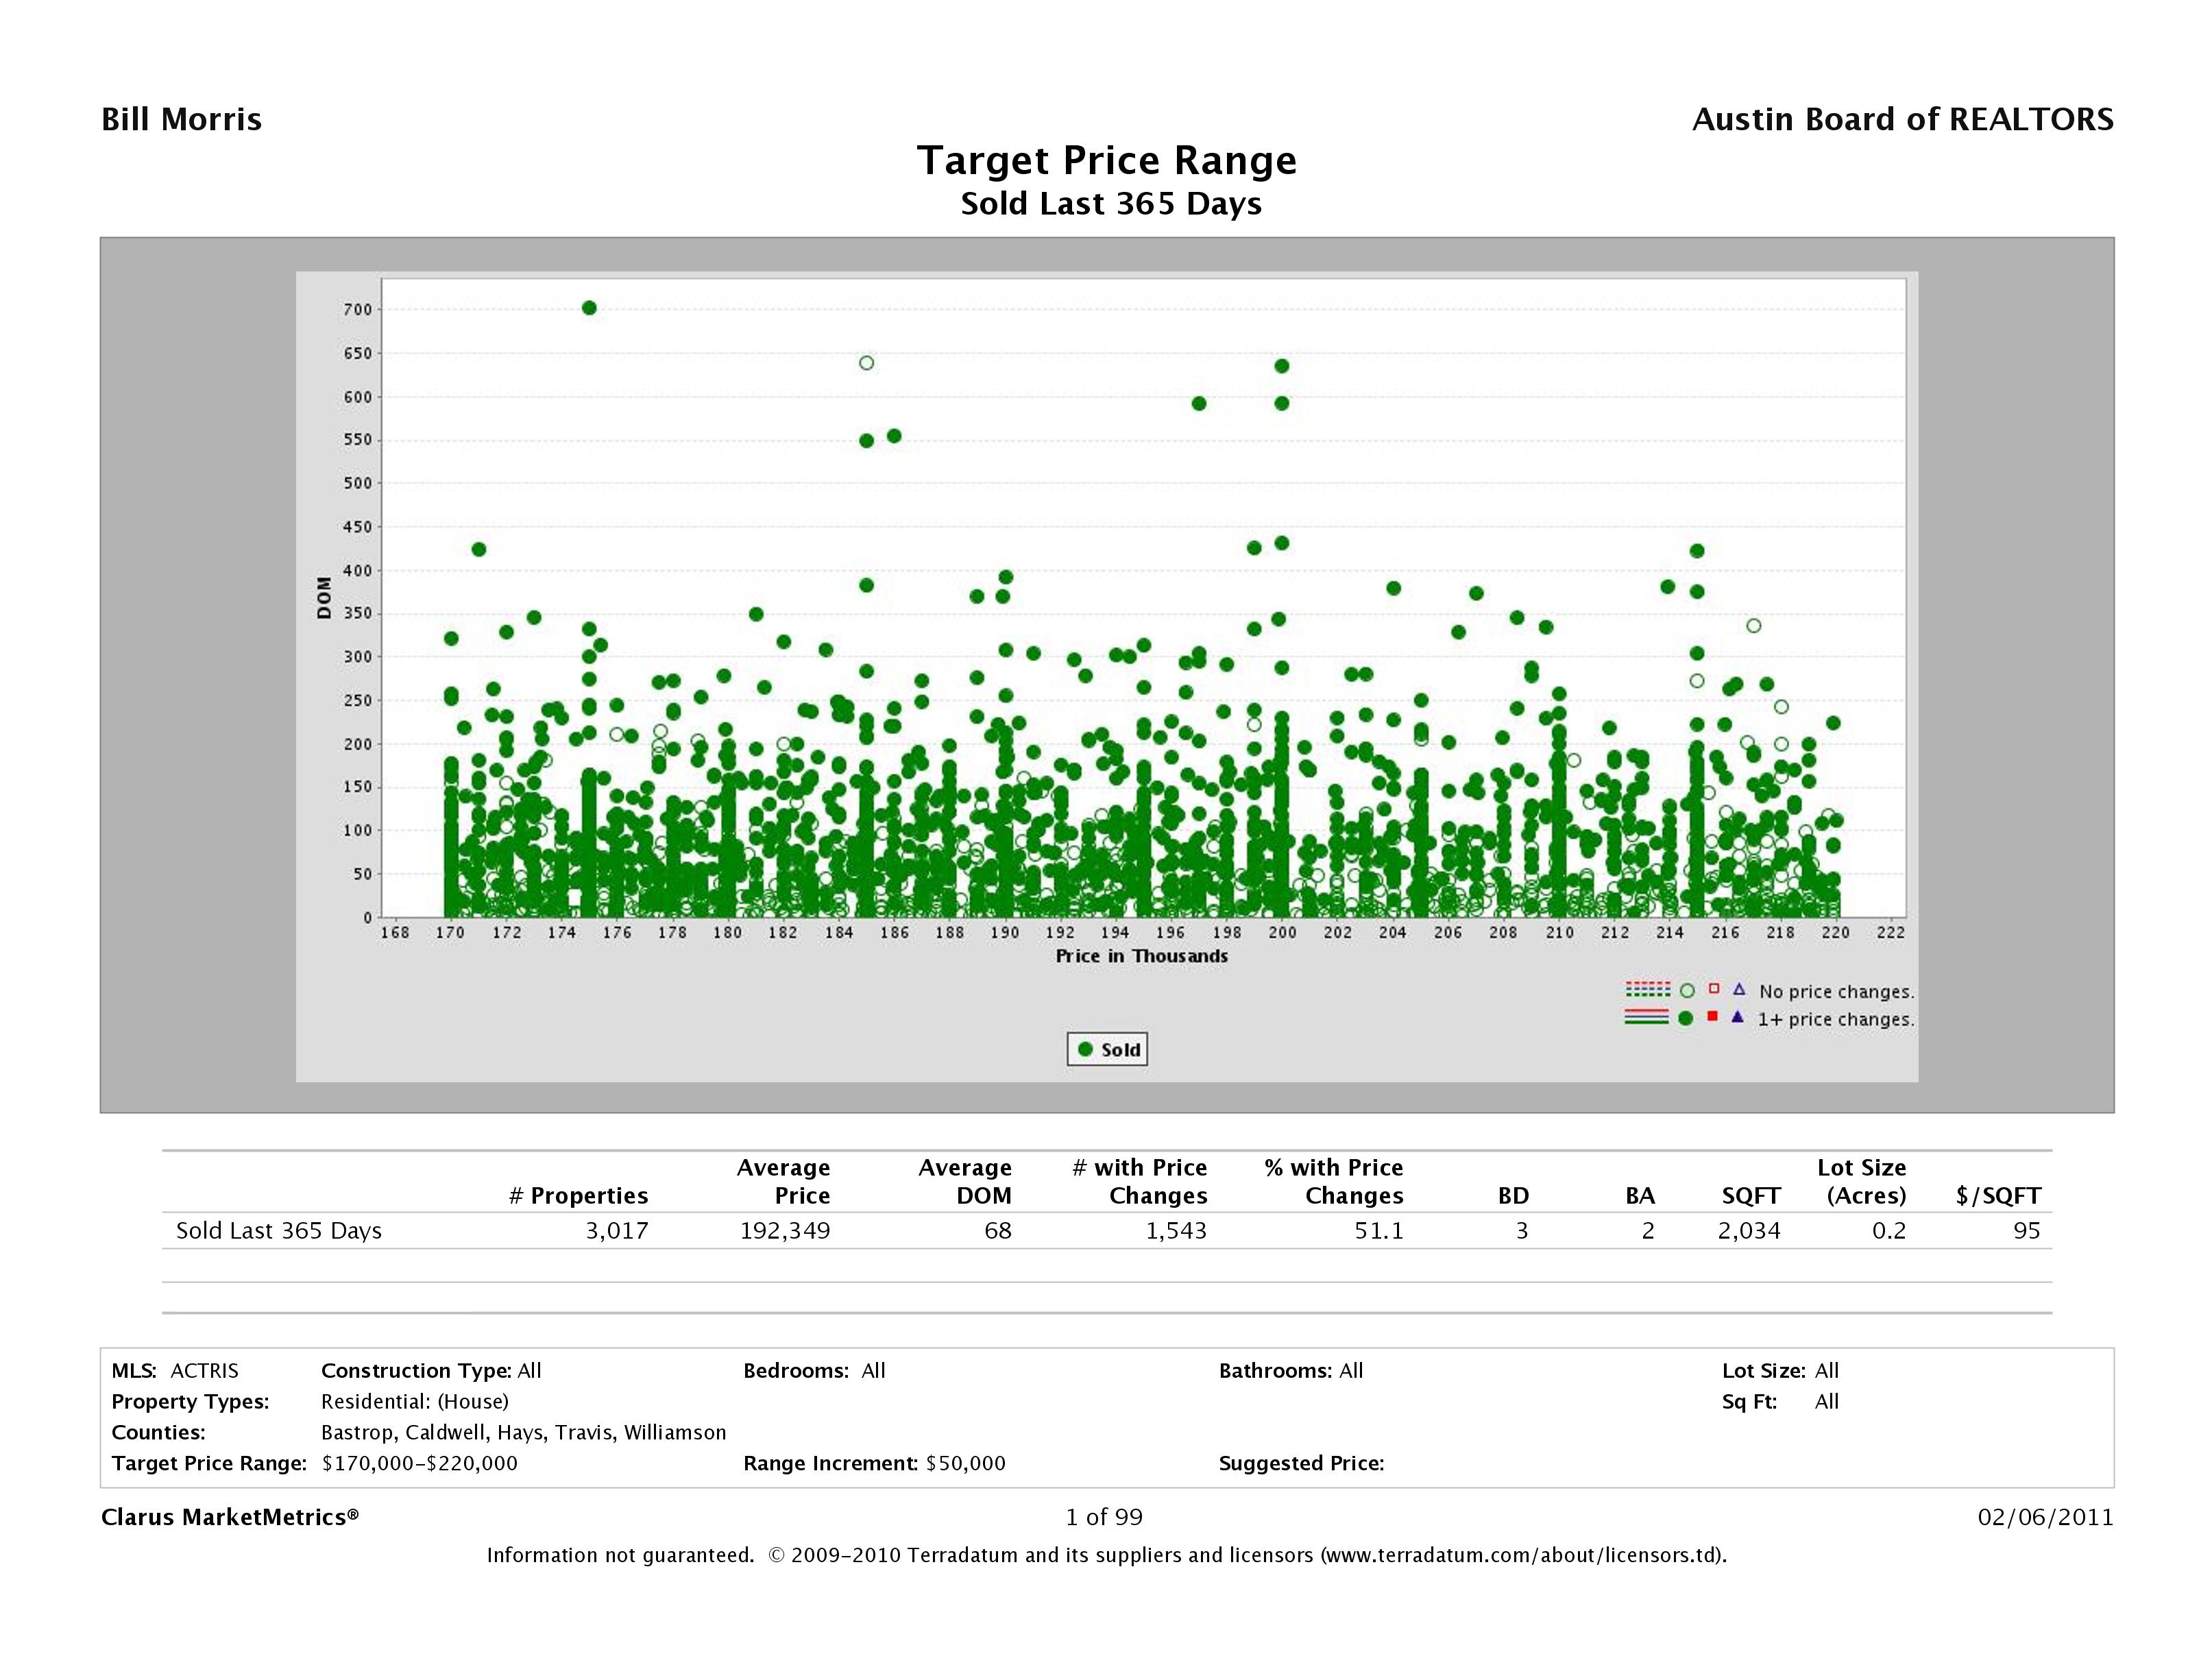
You may click that image to enlarge it, but what you will see is that 3,017 homes sold in this price range for an average price of $192,349, after 68 days on market. Not bad, huh? There are a lot of sellers, here and elsewhere, that would be thrilled to have their homes under contract in two months.
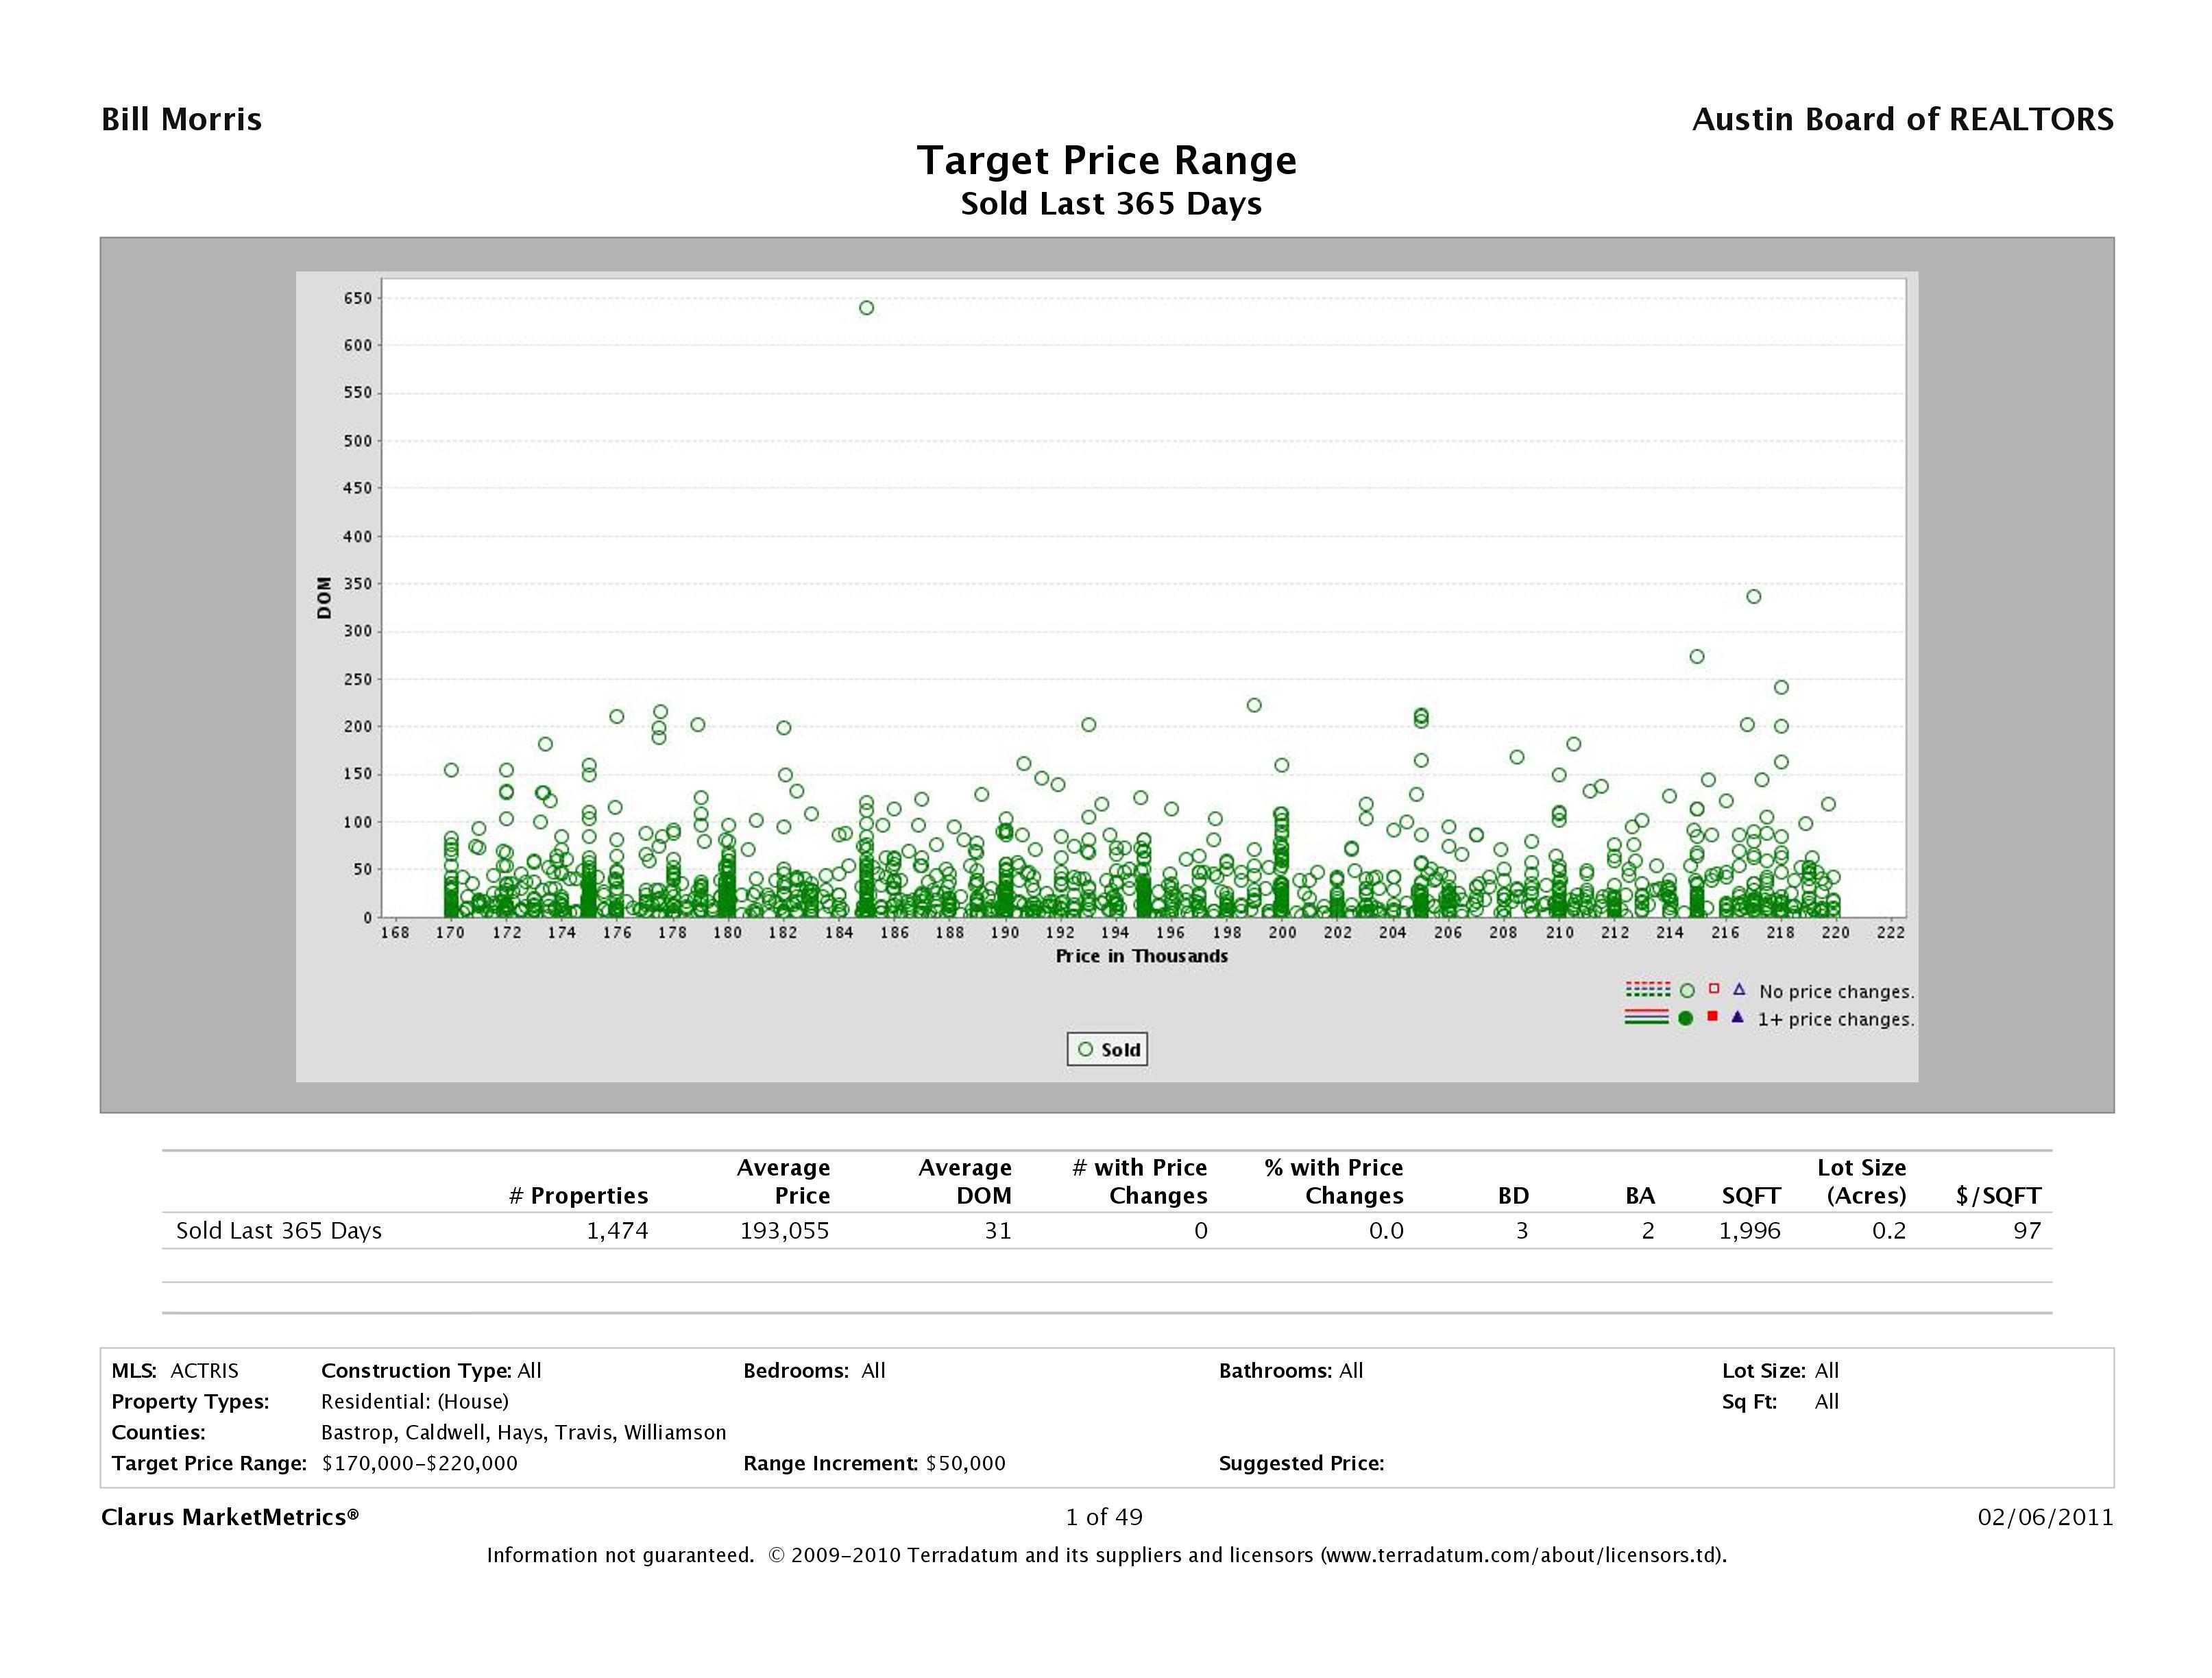
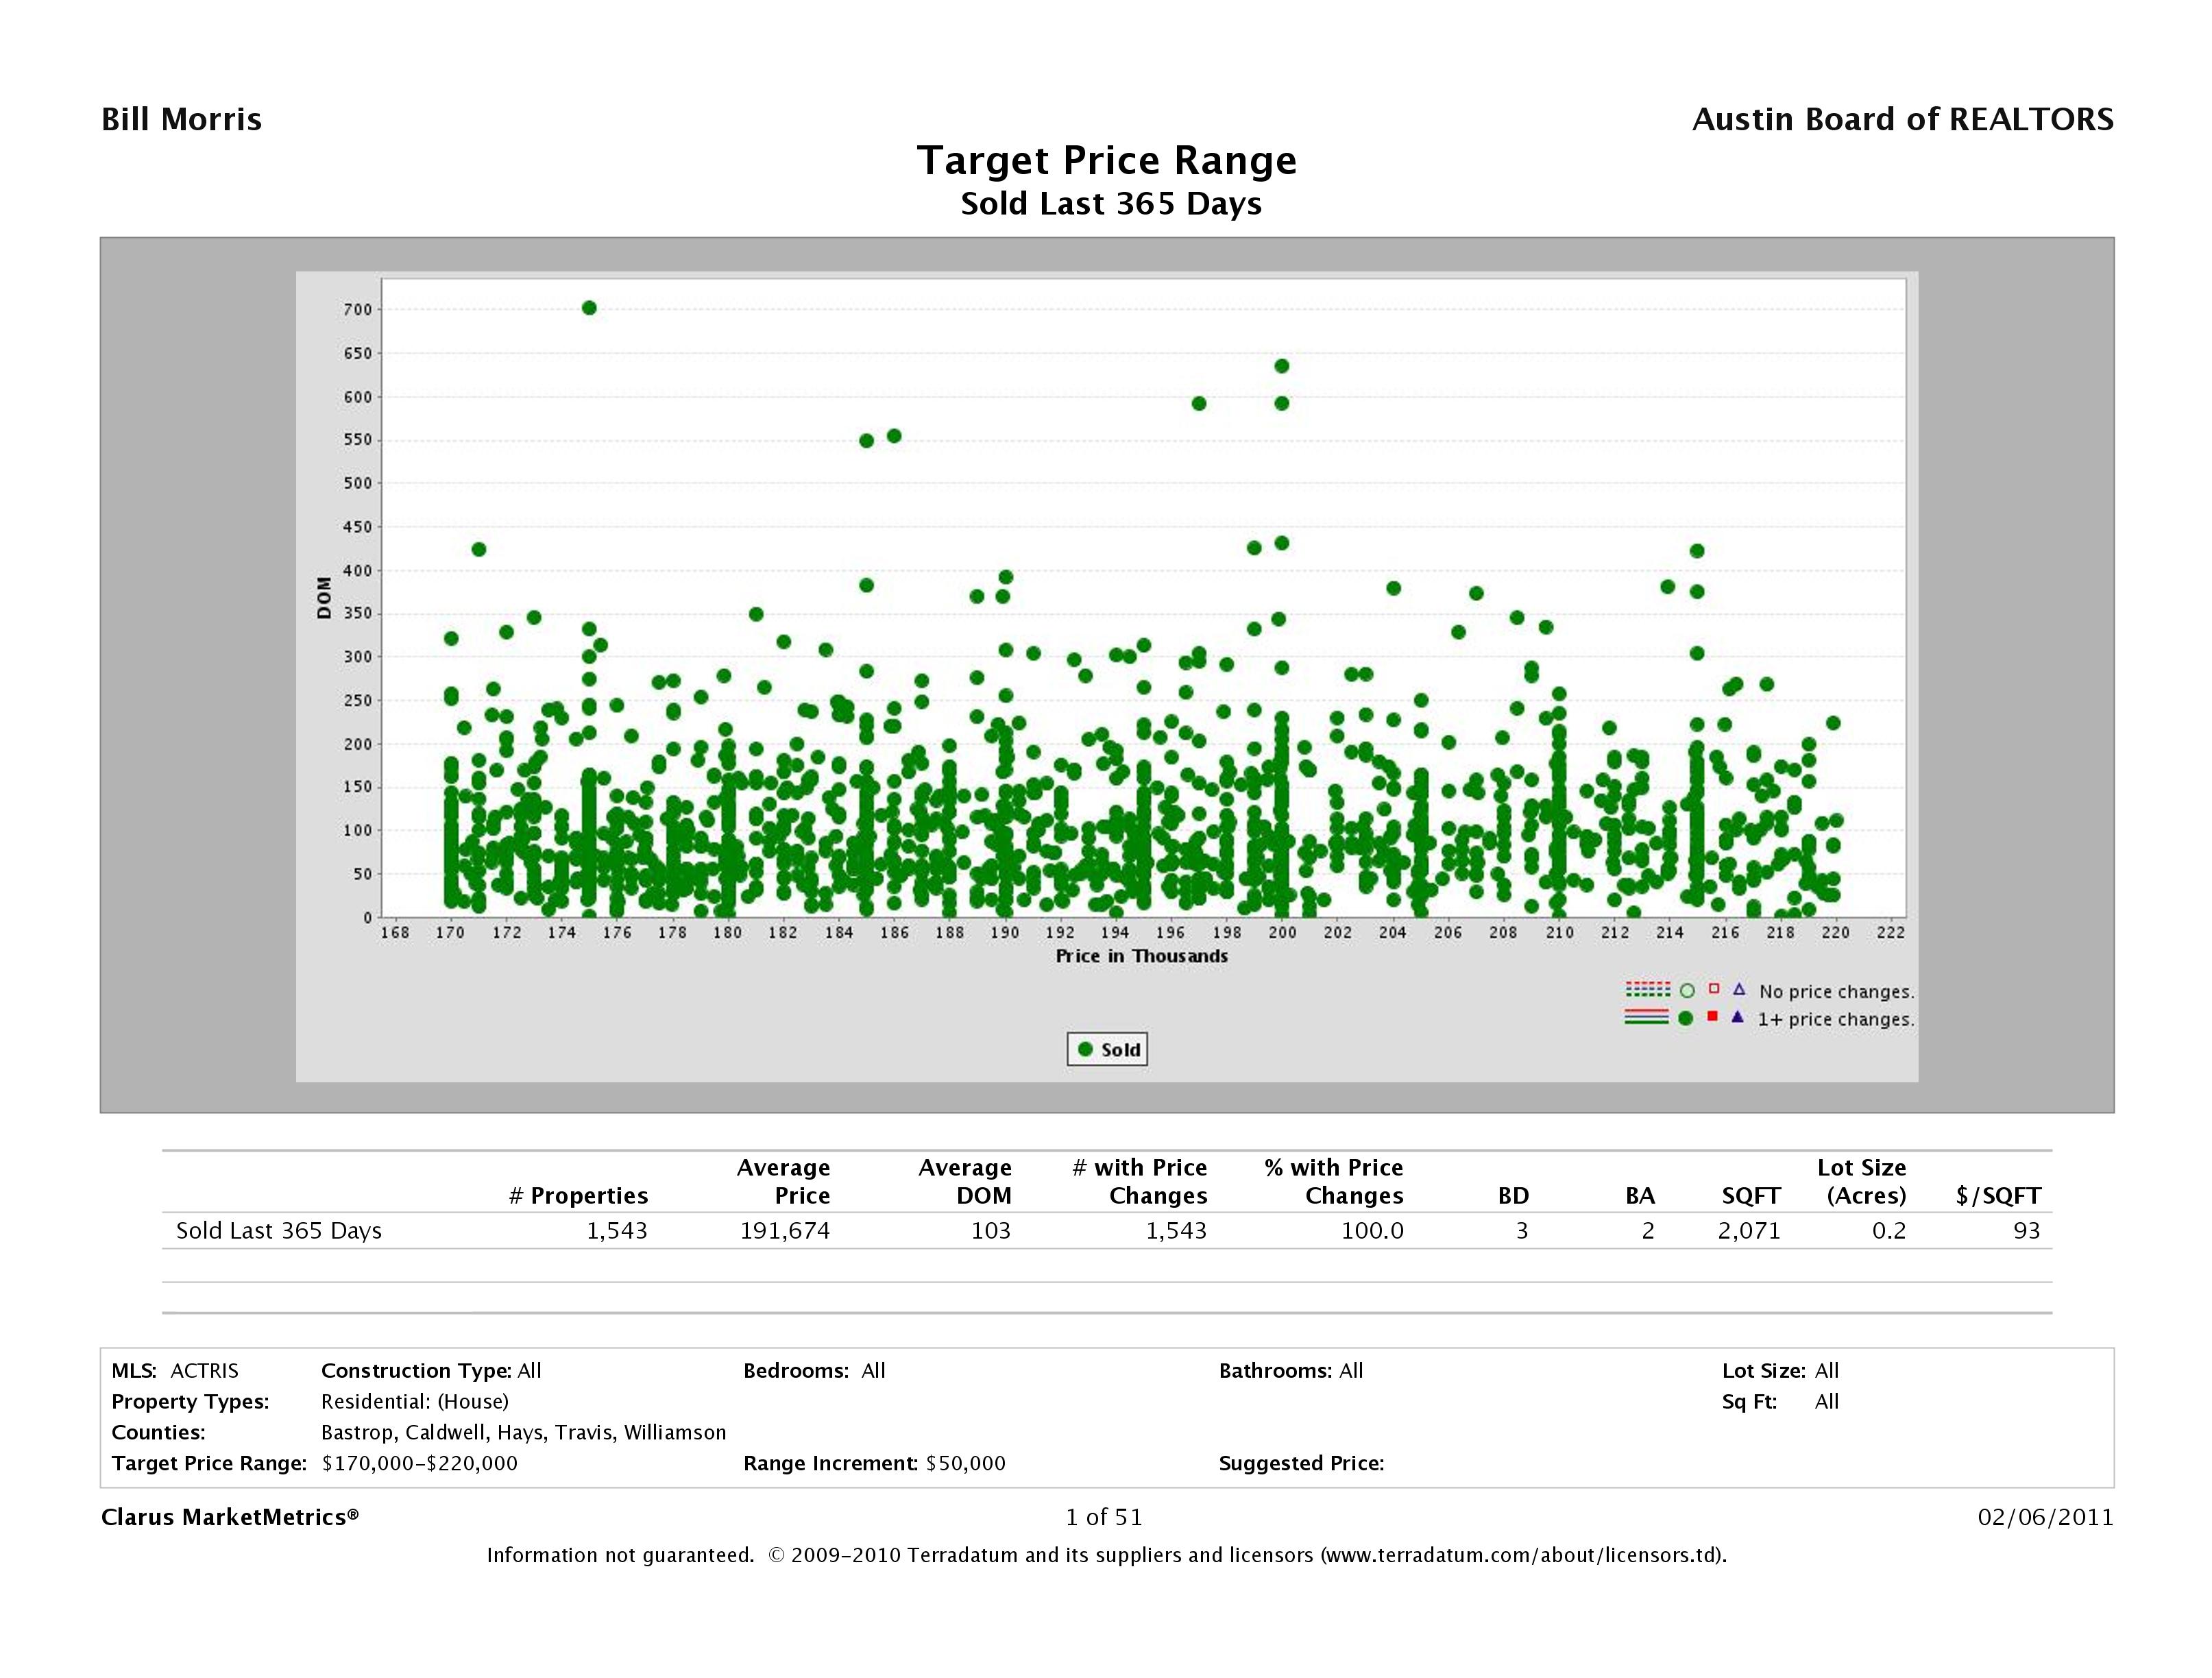
Now here’s where you may be surprised. Here are two charts — one showing homes that were priced correctly from the beginning and another focused on those that took one or more price reductions to sell:
Again, click to enlarge, but here’s the meat:
| Avg DaysOn Market |
Avg SalePrice |
AvgSq Ft | Avg$/Sq Ft | |
| Sold with no price changes |
31 | $193,055 | 1,996 | $97 |
| Sold with 1 or more price changes | 103 | $191,674 | 2,071 | $93 |
Yes, that’s right. Starting with a high price resulted in spending more than three times as long on the market and selling for less. This is NOT a statistical anomaly. We’re working with a sample of more than 3,000 properties. Besides, I have done this many times with many market segments and the result is consistent.
“Yeah, but ….” It’s reasonable to ask, “How high is too high?” This chart gives you an idea:
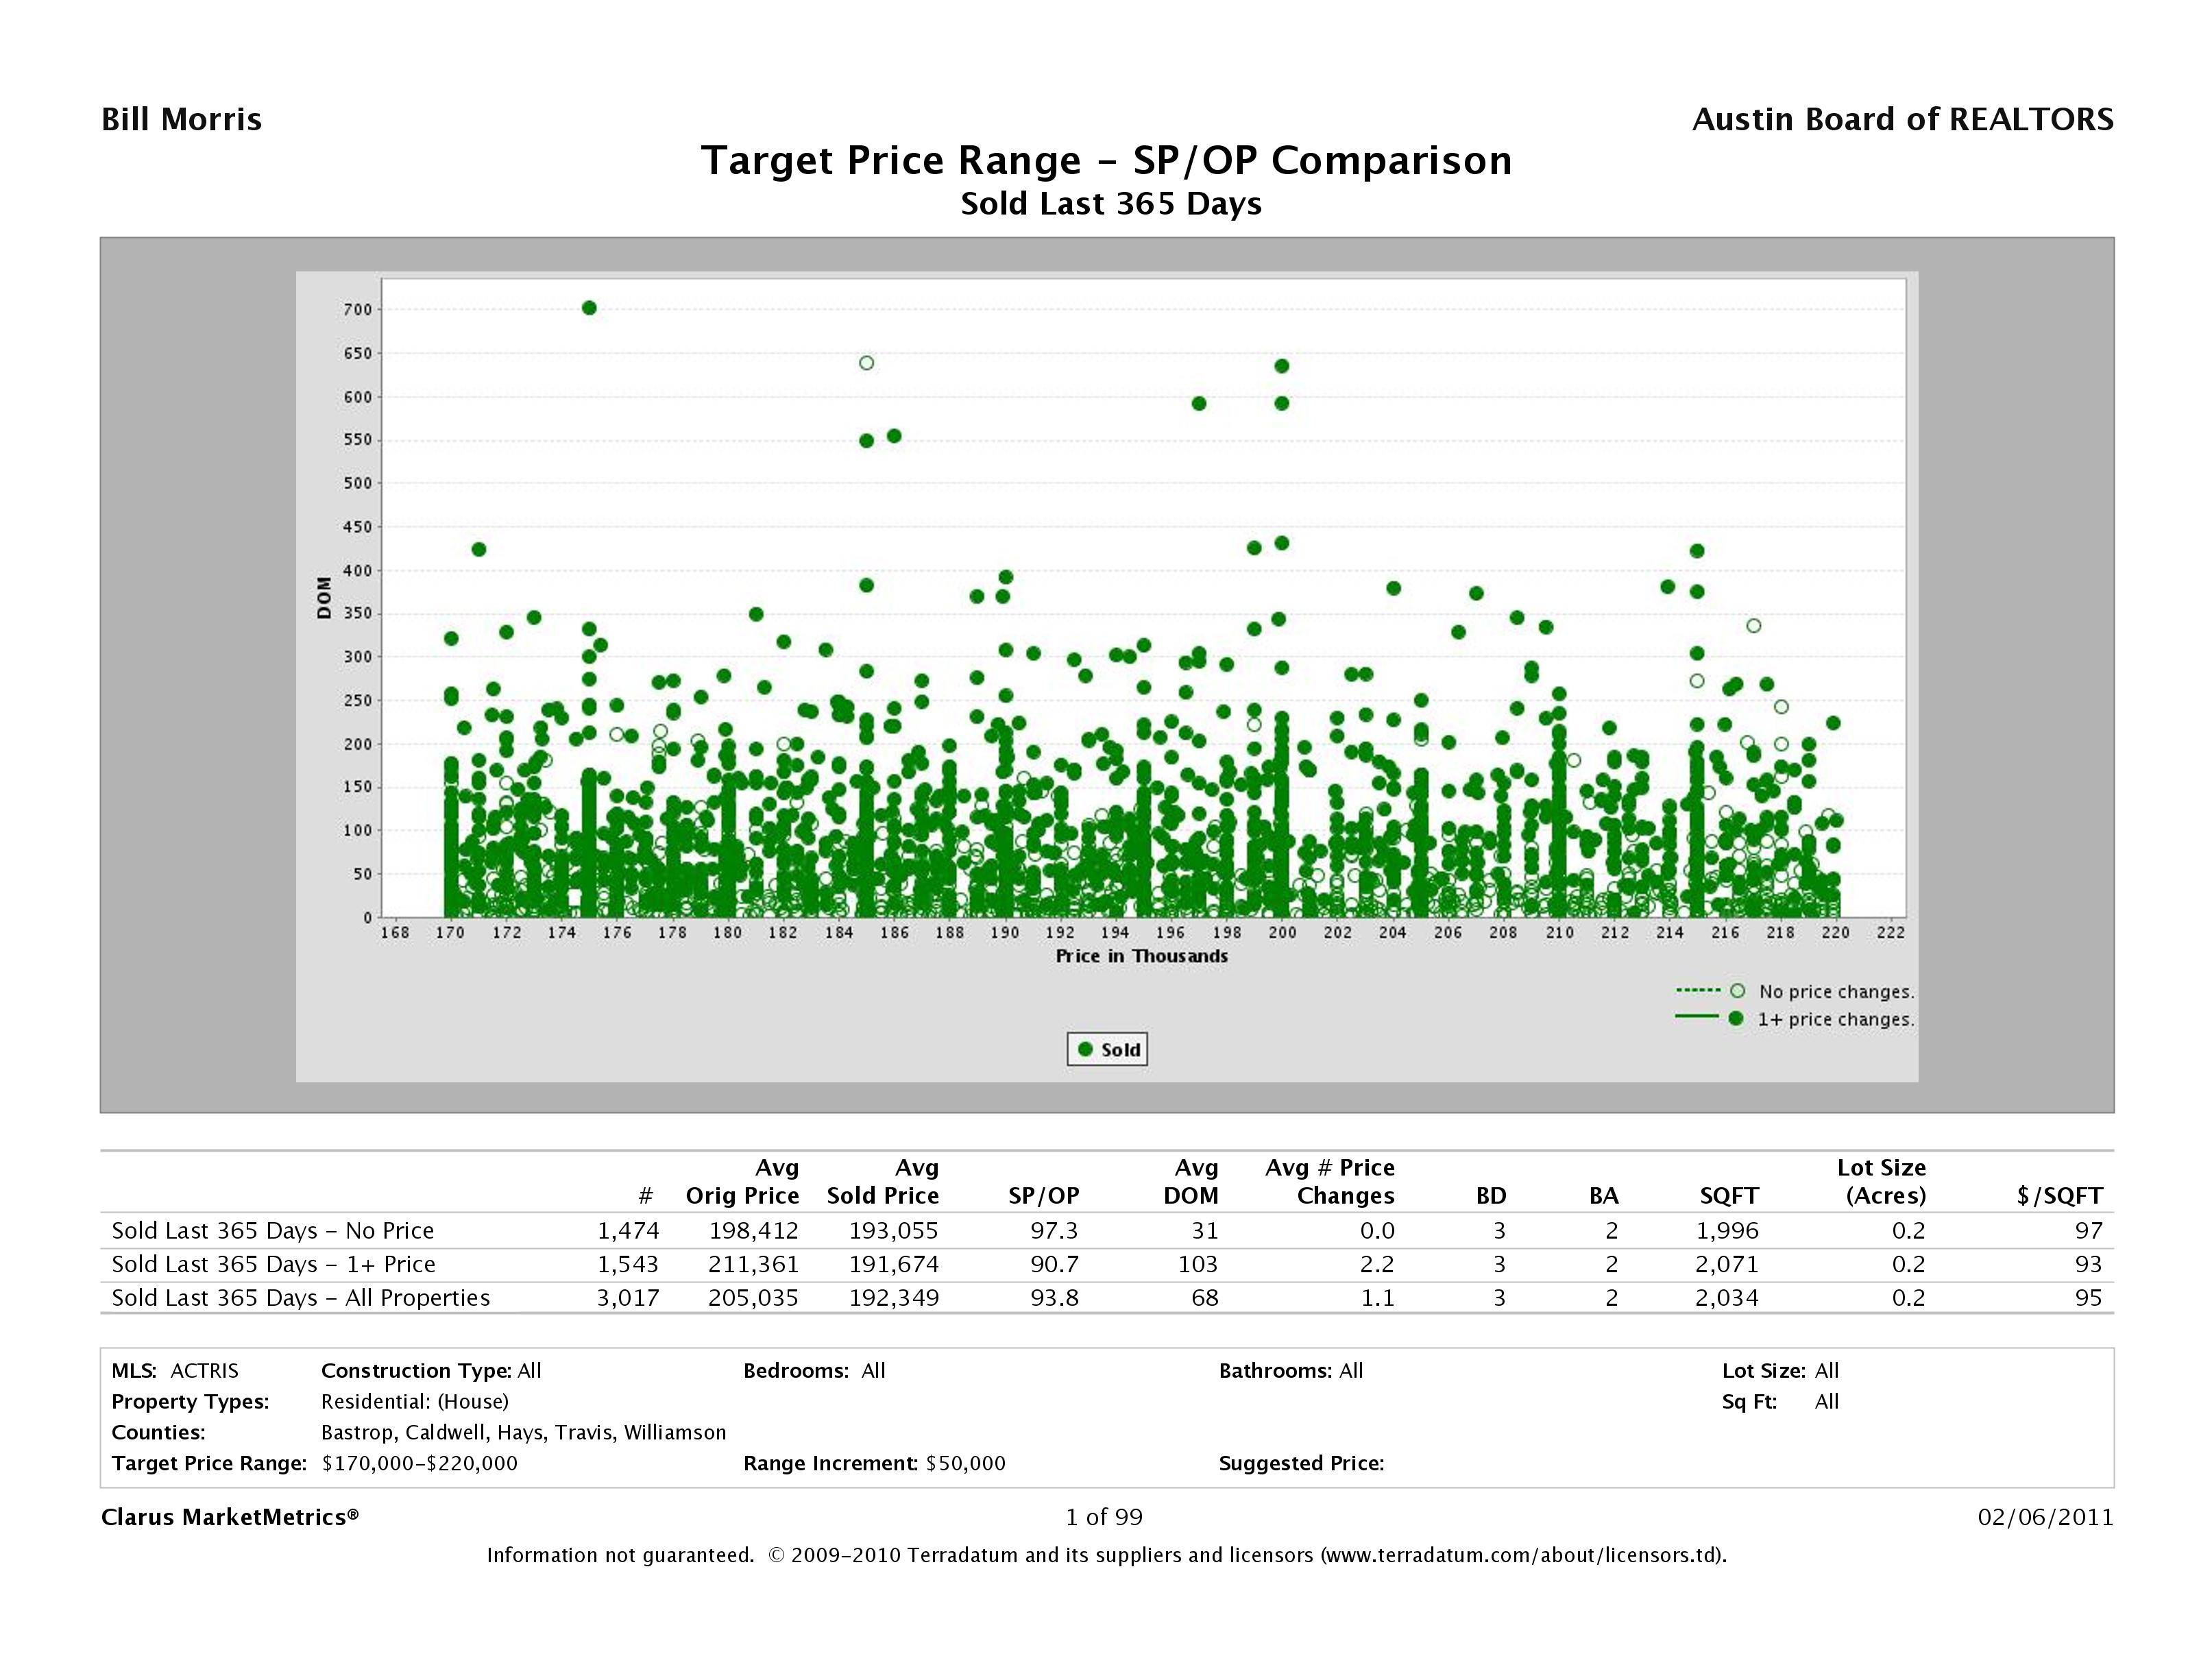
About 1,500 homes sold without any price changes and about 1,500 needed one or more price reductions. On average the original price of the second group was just 6% higher than the first group. After triple the time on market, they sold for 90.7% of the original price, versus 97.3% for those that were properly priced from day one.
As a real estate professional, my job is to give my clients the best advice and counsel my training and experience allow. My job is also to honor my client’s wishes as long as they are legal and ethical. If a client wants to test a higher price than I recommend — within reason — then that’s what we’ll do. But for a seller that wants or needs to sell a home, proper pricing supported by comprehensive preparation, staging, marketing, sales, and follow-up is the right decision.

Excellent post! ABOR should send this to every agent and seller.
Posted by Mr. Bubble | February 7, 2011, 11:01 PMThanks, Mr. Bubble. It’s always good to hear from you.
Posted by billmorrisrealtor | February 7, 2011, 11:08 PM