In “typical” years, residential real estate enjoys a surge in activity during the summer months that generally ends near the beginning of the public school sessions. The infographics included with this post use MLS data and show that this was NOT a typical selling season.
To begin, this broad view of the Austin-Round Rock-San Marcos MSA shows you what most buyers and sellers experienced this year, through August:
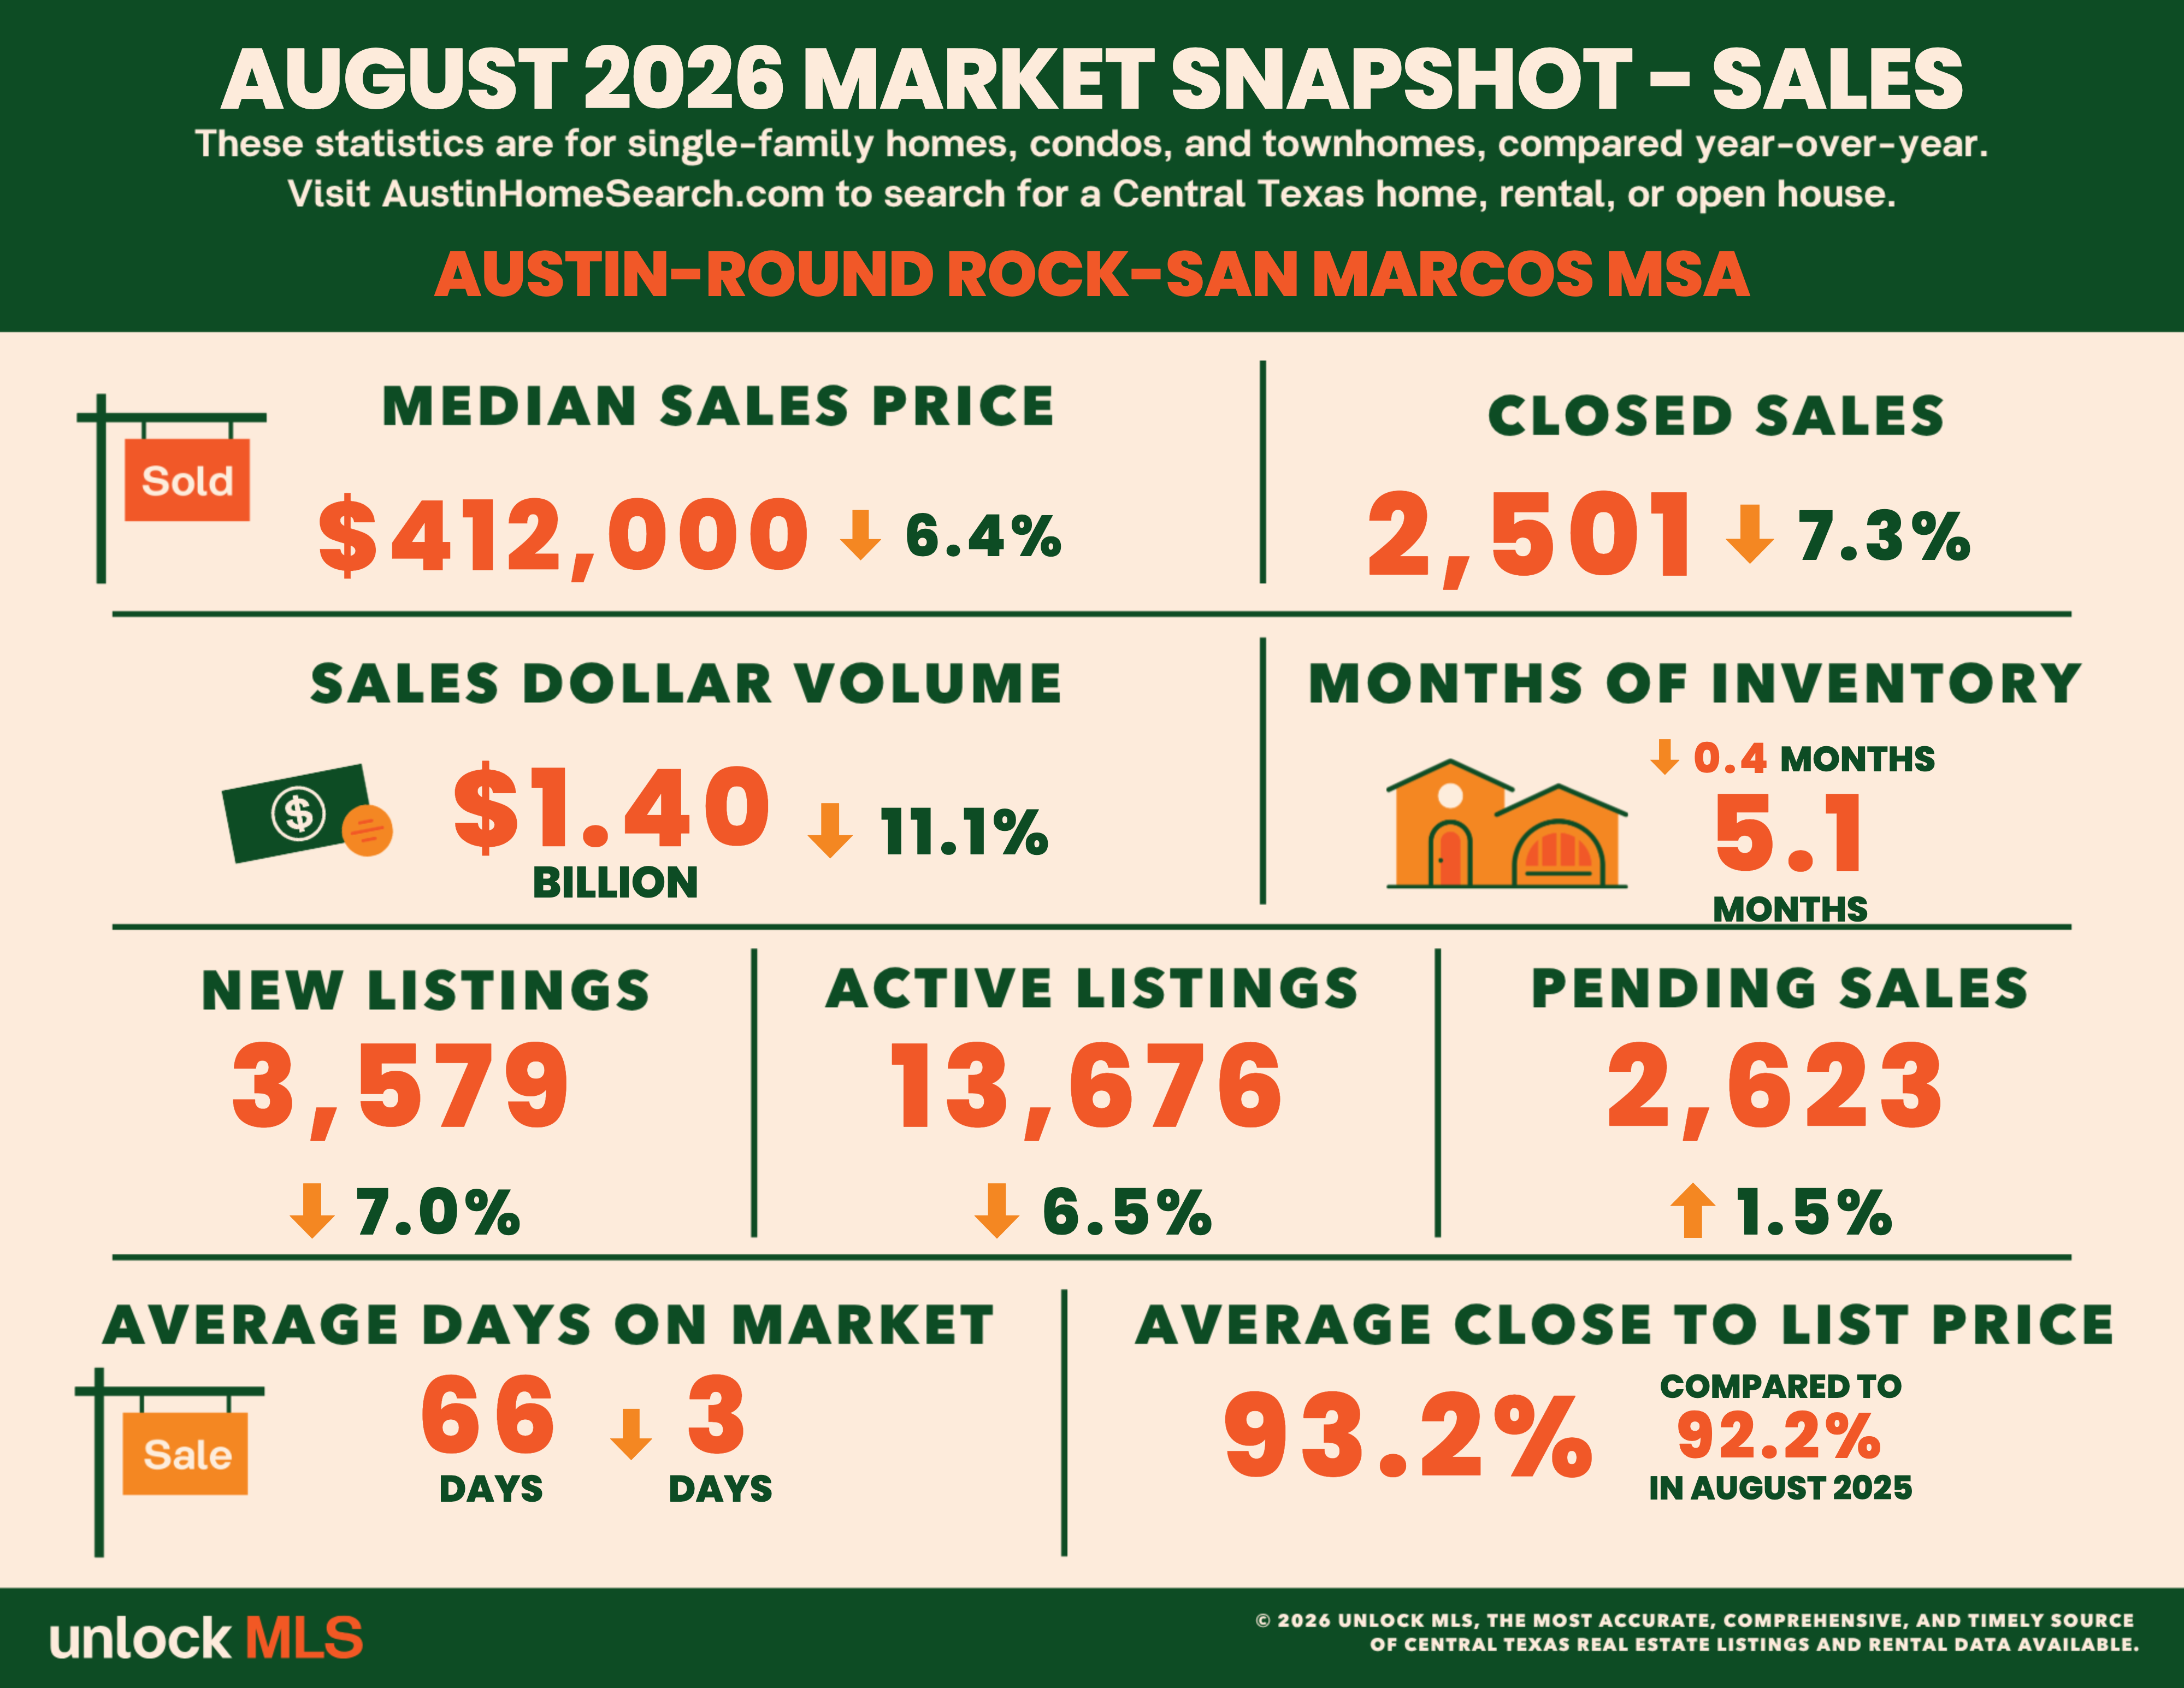
Across our 5-county metropolitan area, the number of Closed Sales in August 2026 was down 7.3% compared to a year before, and the median sales price was down 6.4%. Likewise, the number of New Listings and total Active Listings were down year-over-year. The number of Pending listings increased, which is a positive indicator for closings in September and October. On the other hand, the average ratio of final Closed Price to final List Price was 93.2%, up from the previous August. That means that, on average, the $412,000 median home was priced at $442,060 when the successful sale contract was executed.
This graphic shows the same information about August activity in the City of Austin:
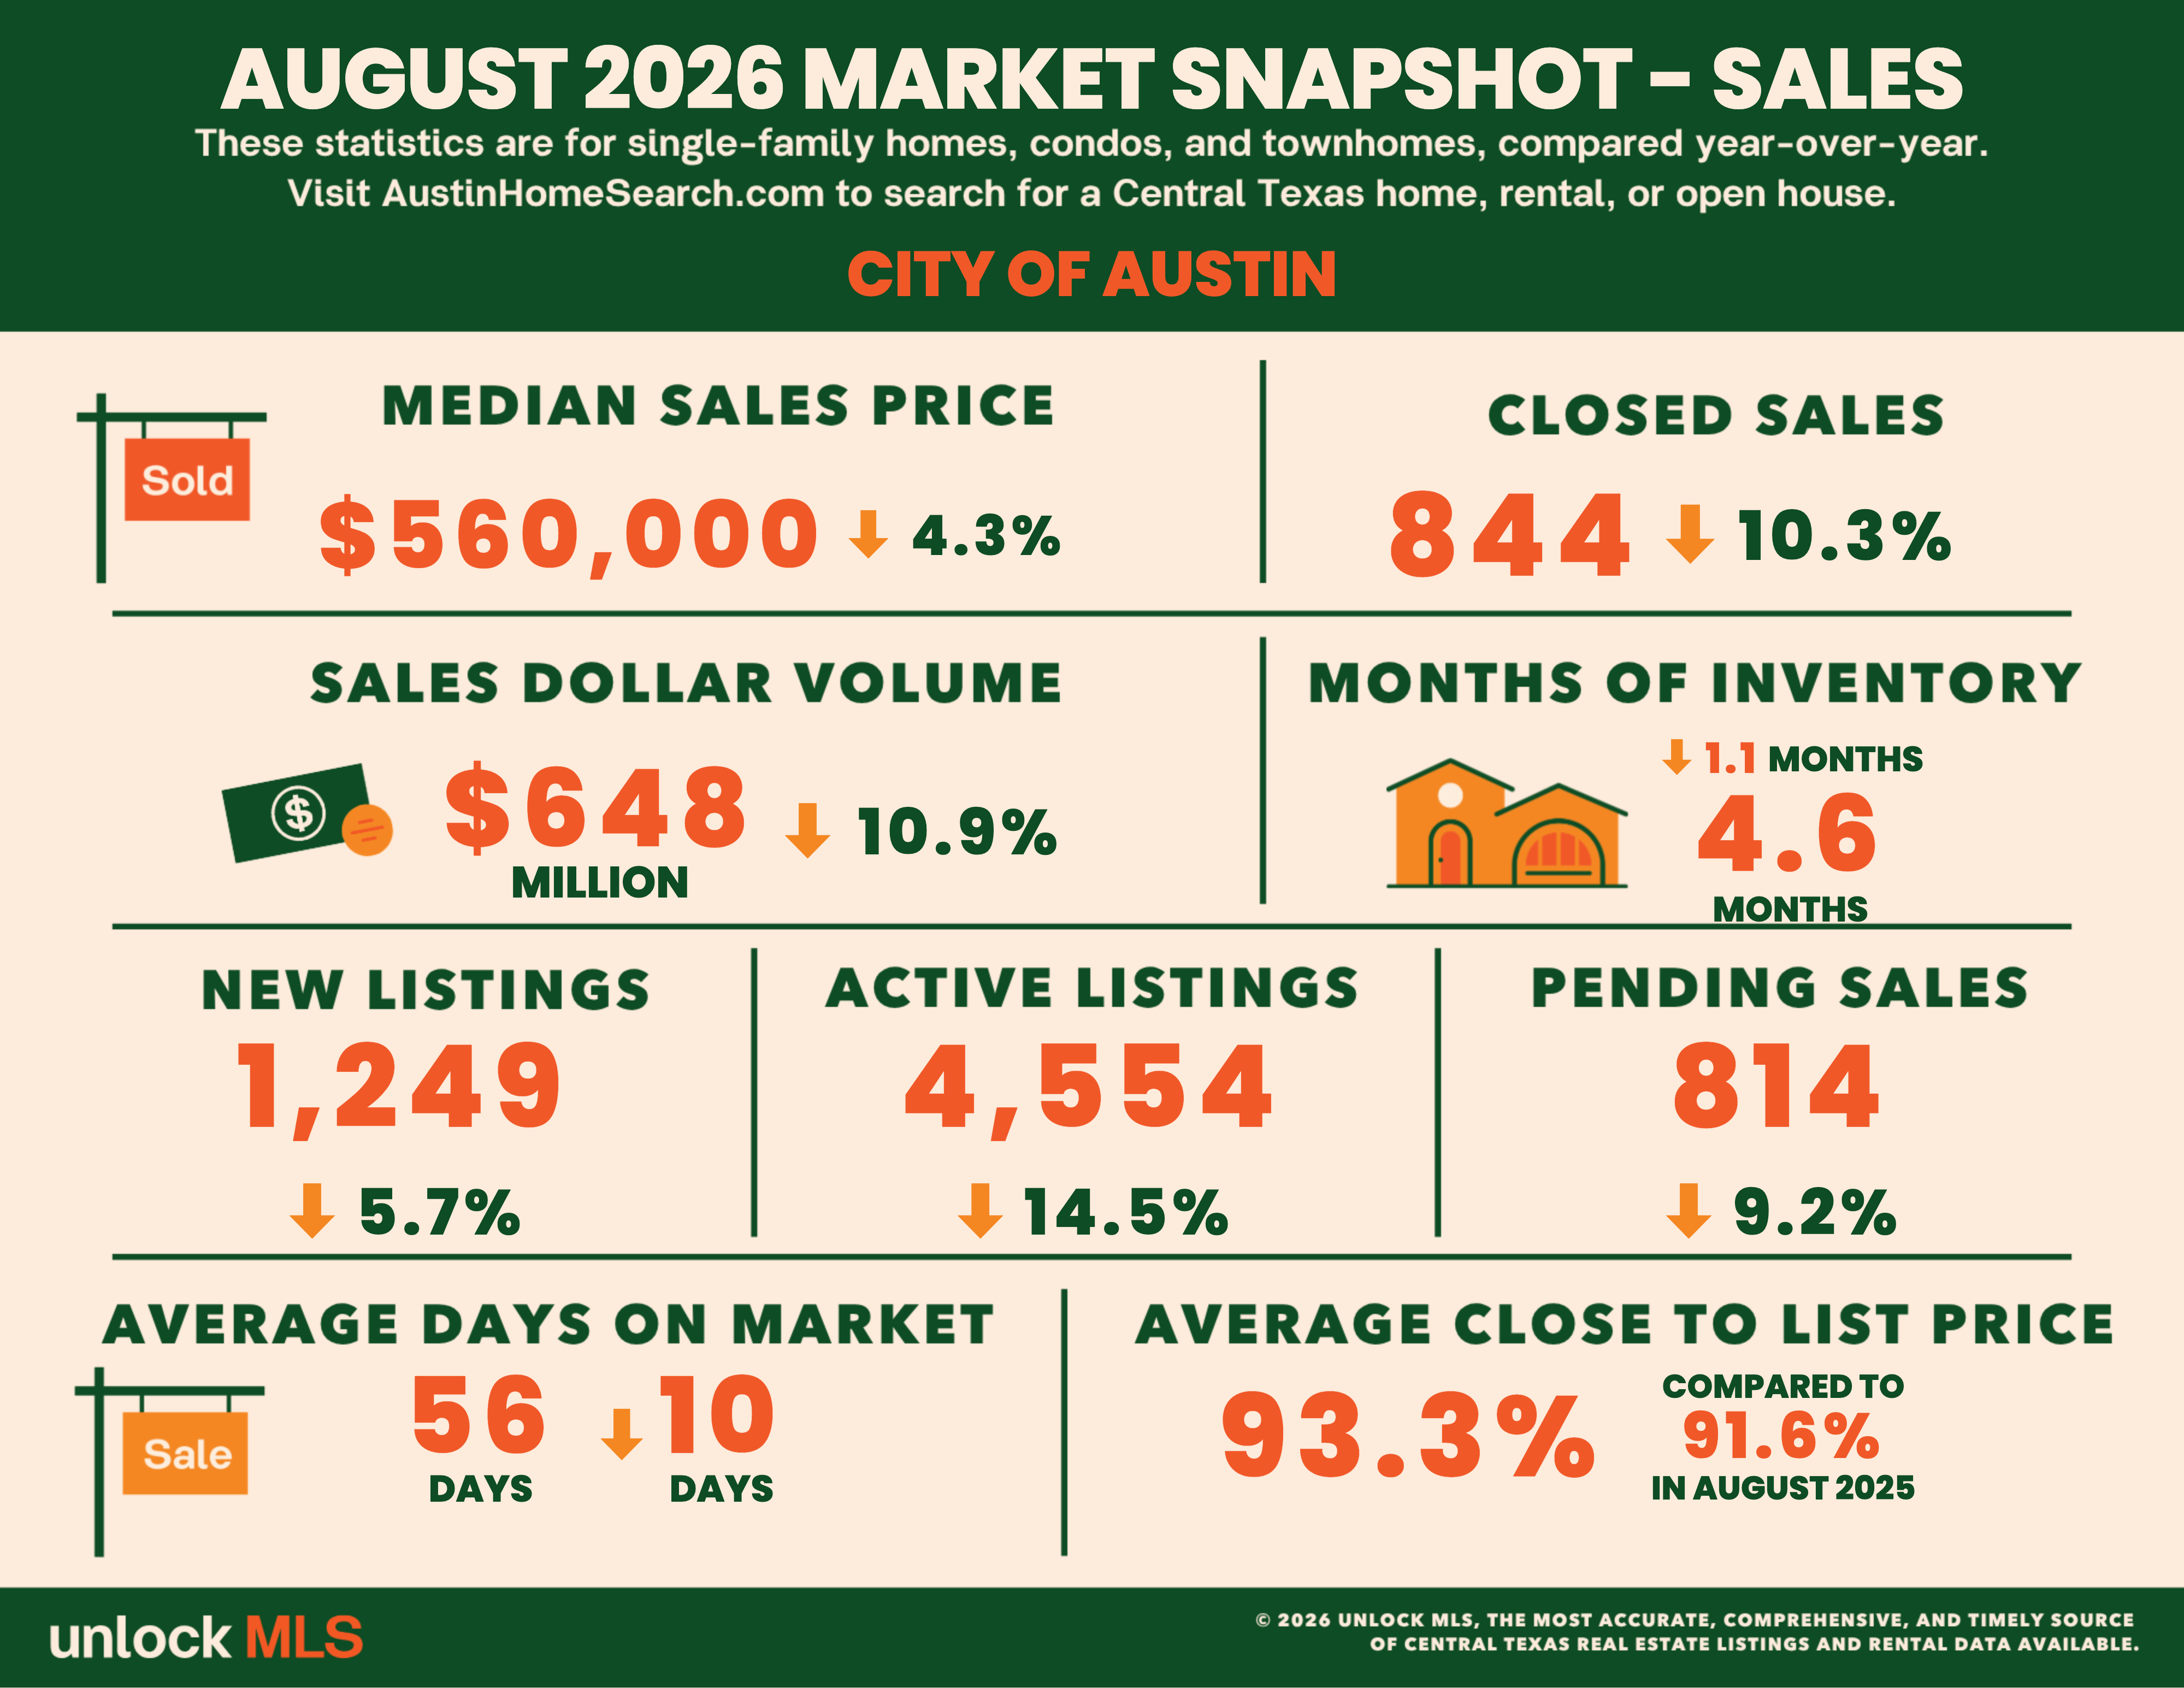
Directionallly, the year-over-year changes in Austin were very similar to those we saw across the metro area, but with an important difference: a decline in the number of Pending Sales, pointing to a reduction in the number of sales to be Closed in September and October. In the City, the average discount of Close price to List price was about the same as the metro average. The means the average seller of the median home gave up a little more than $40,000 to complete the sale.
To give you an idea of how your area compared to that data, here are the same infographics for the five counties that comprise our MSA:
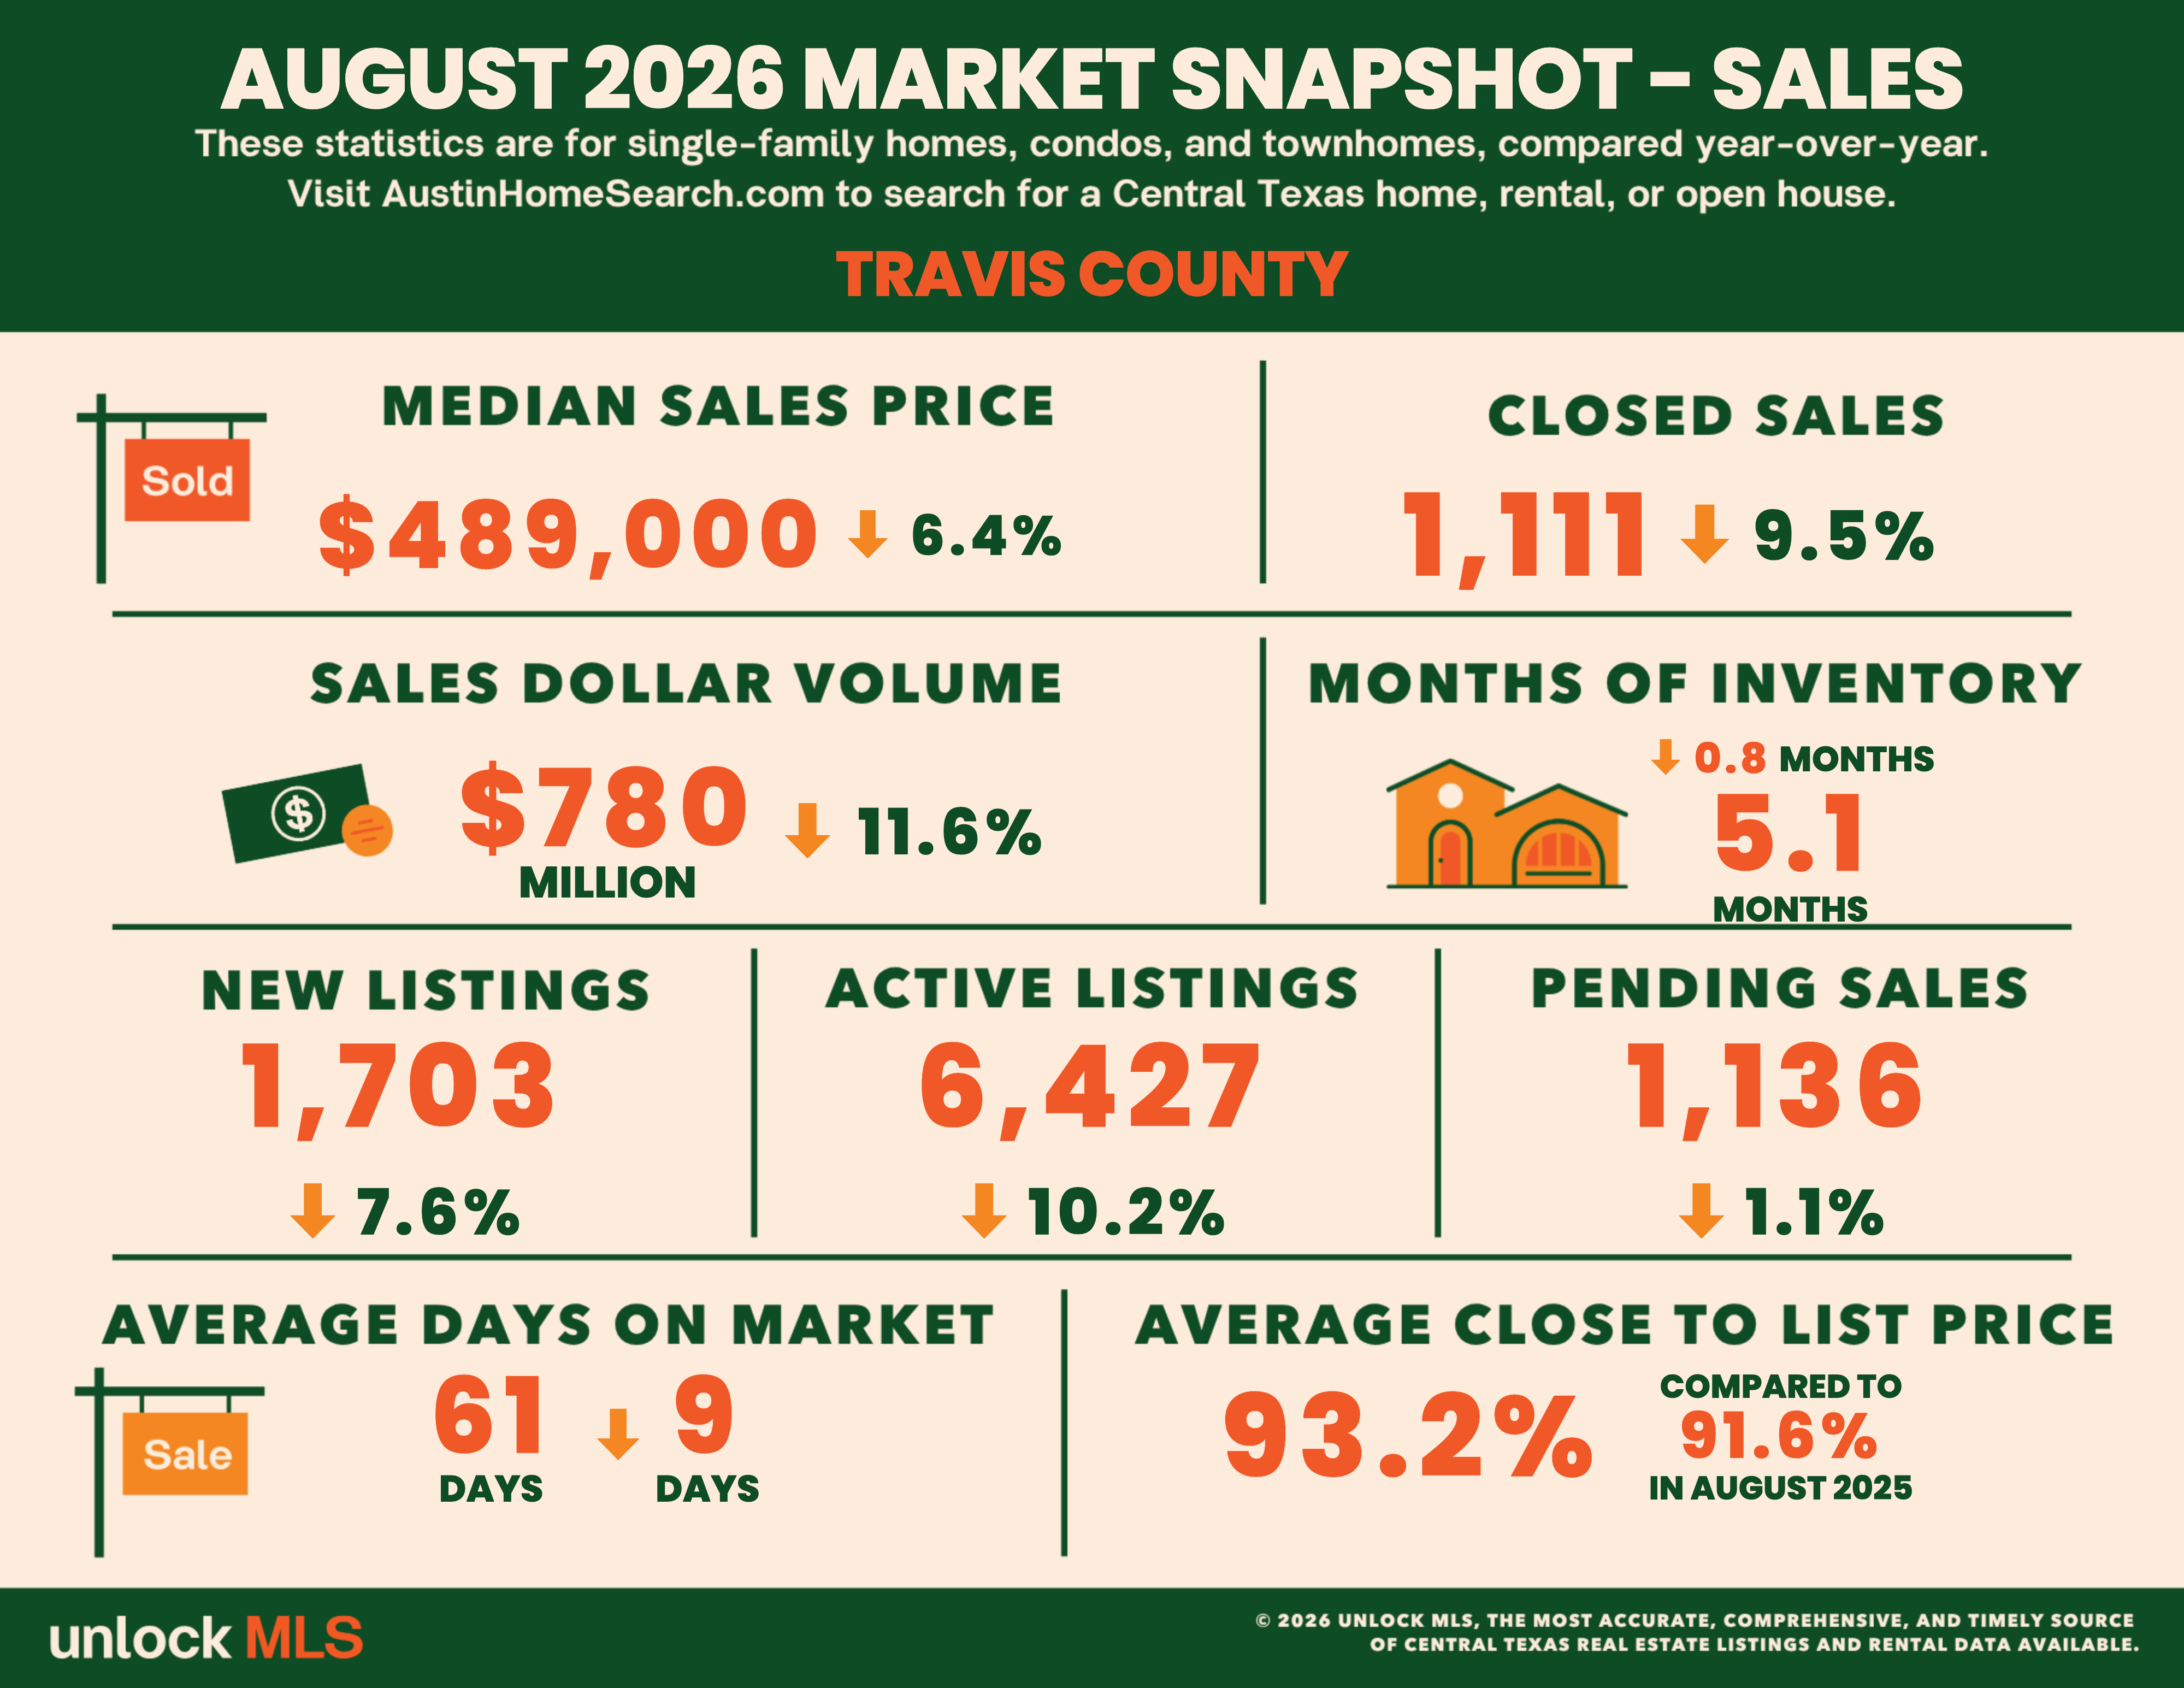
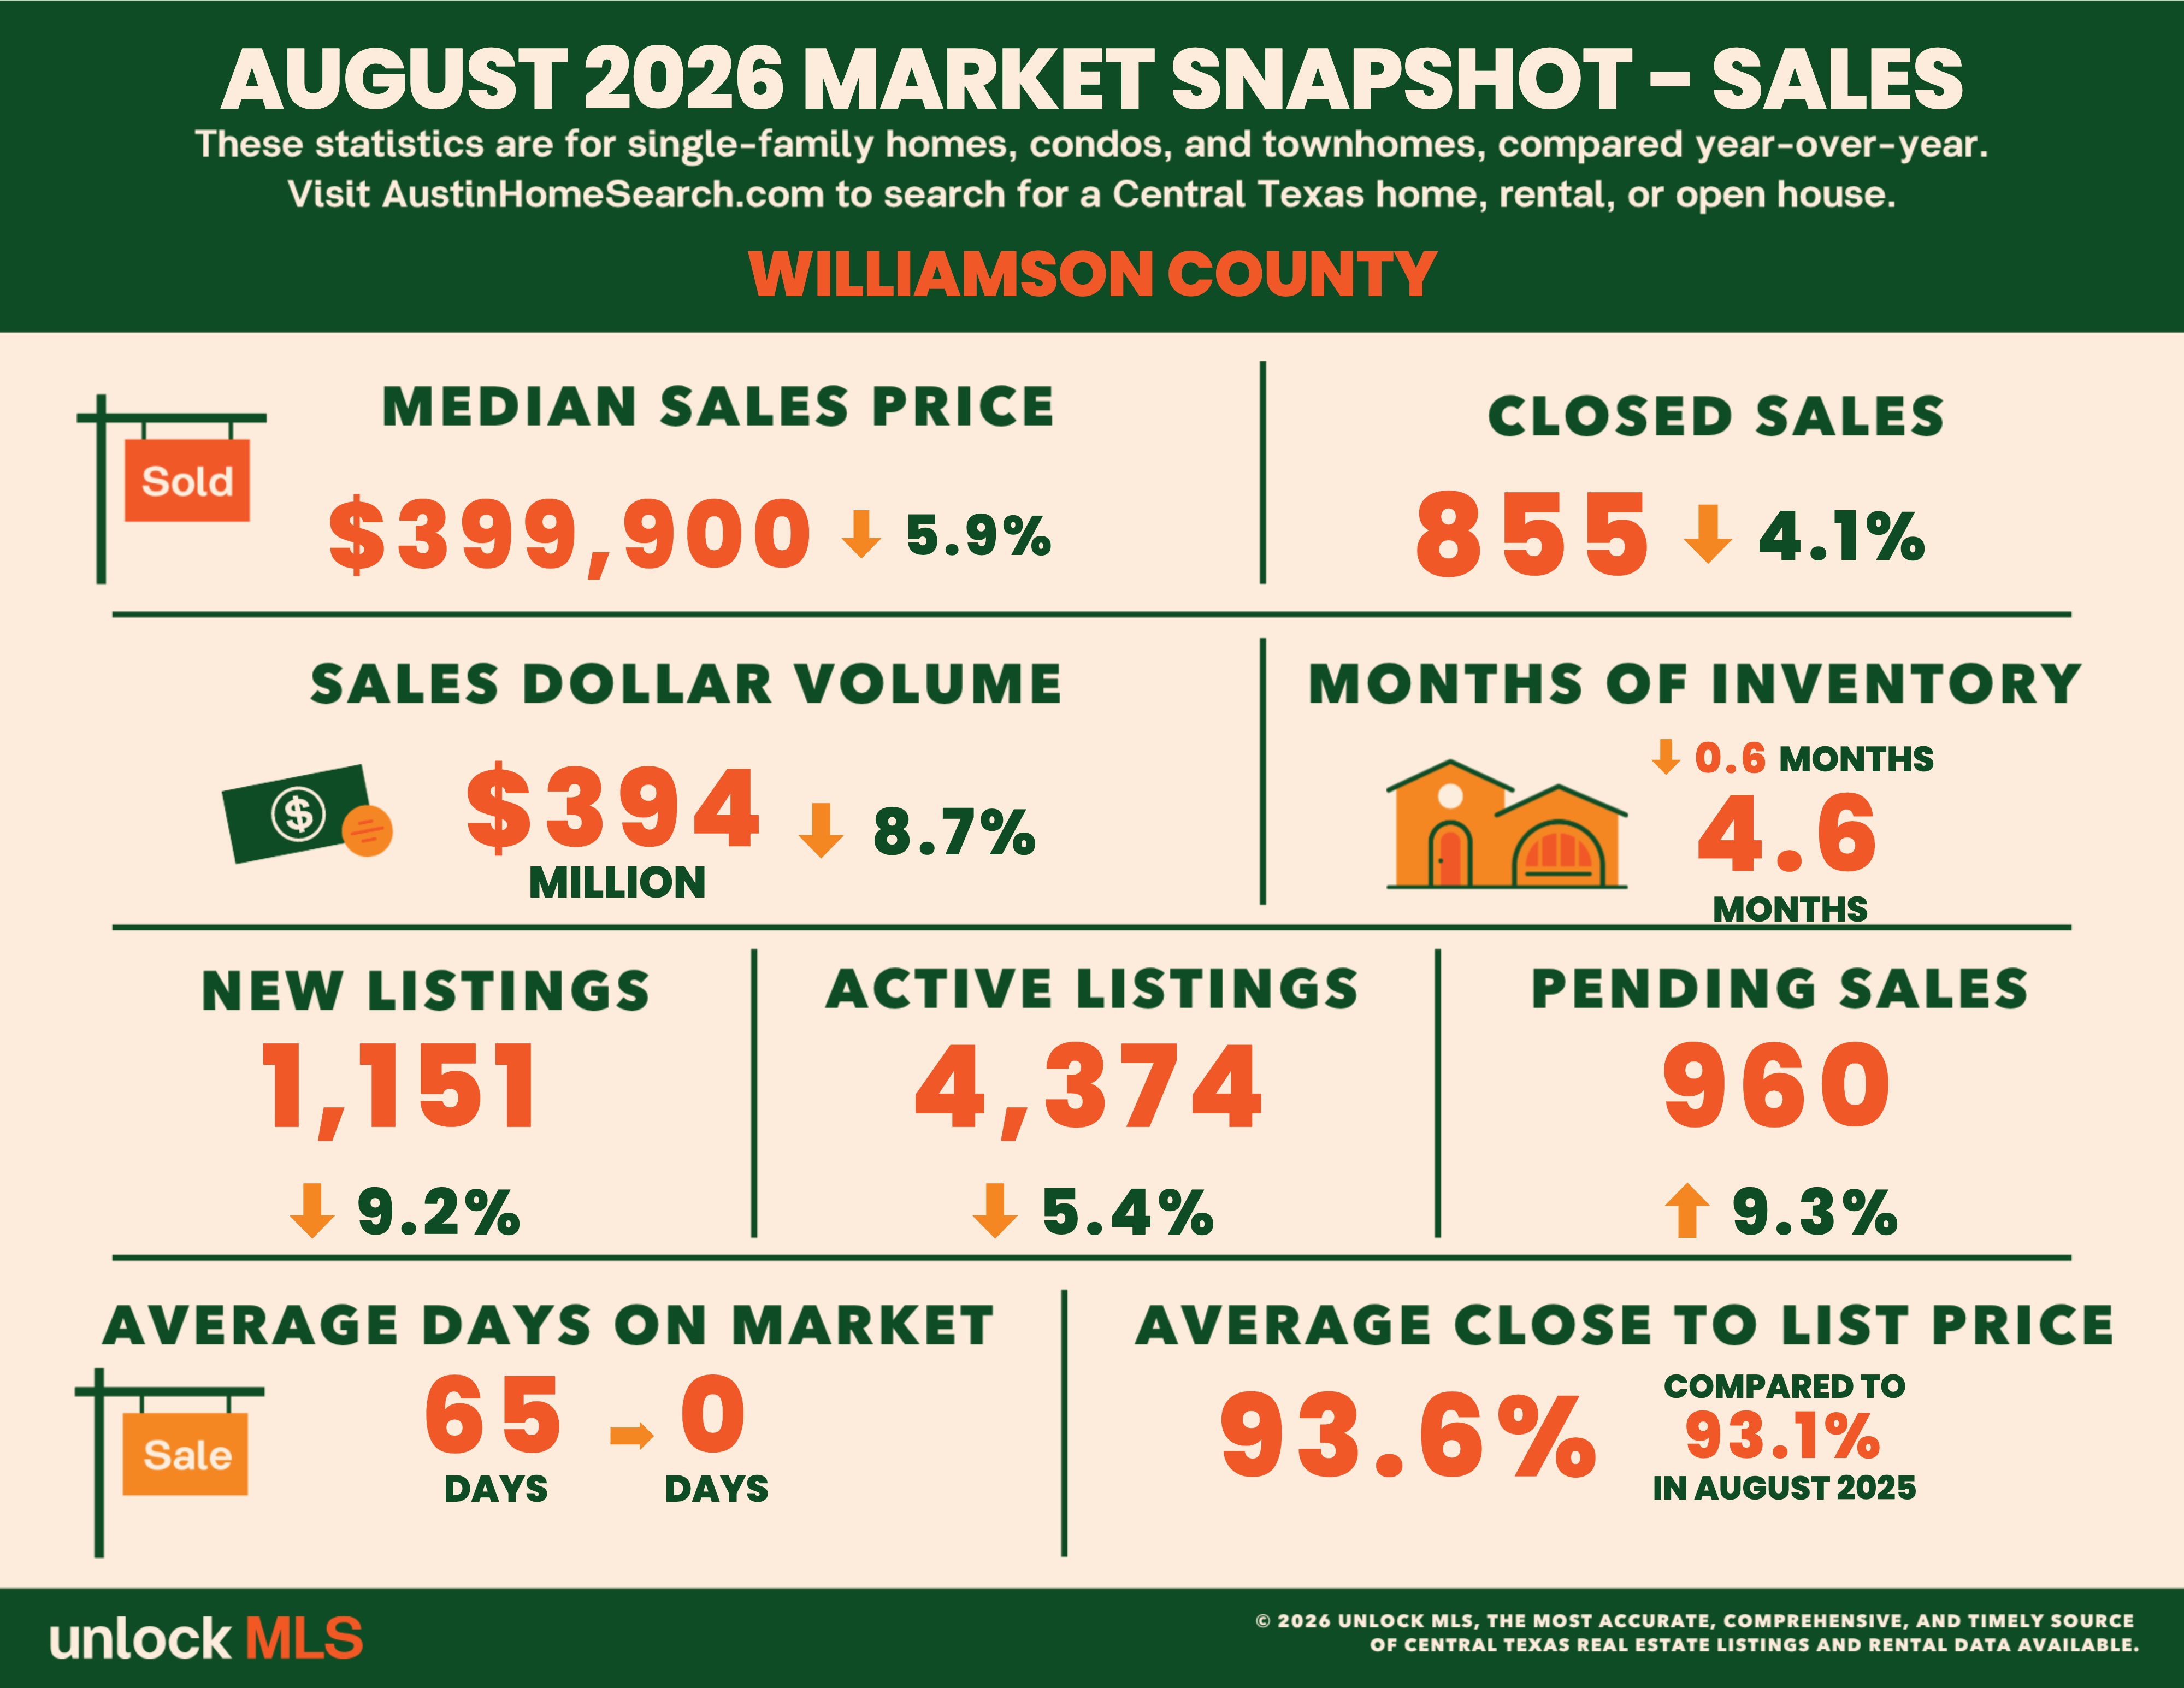
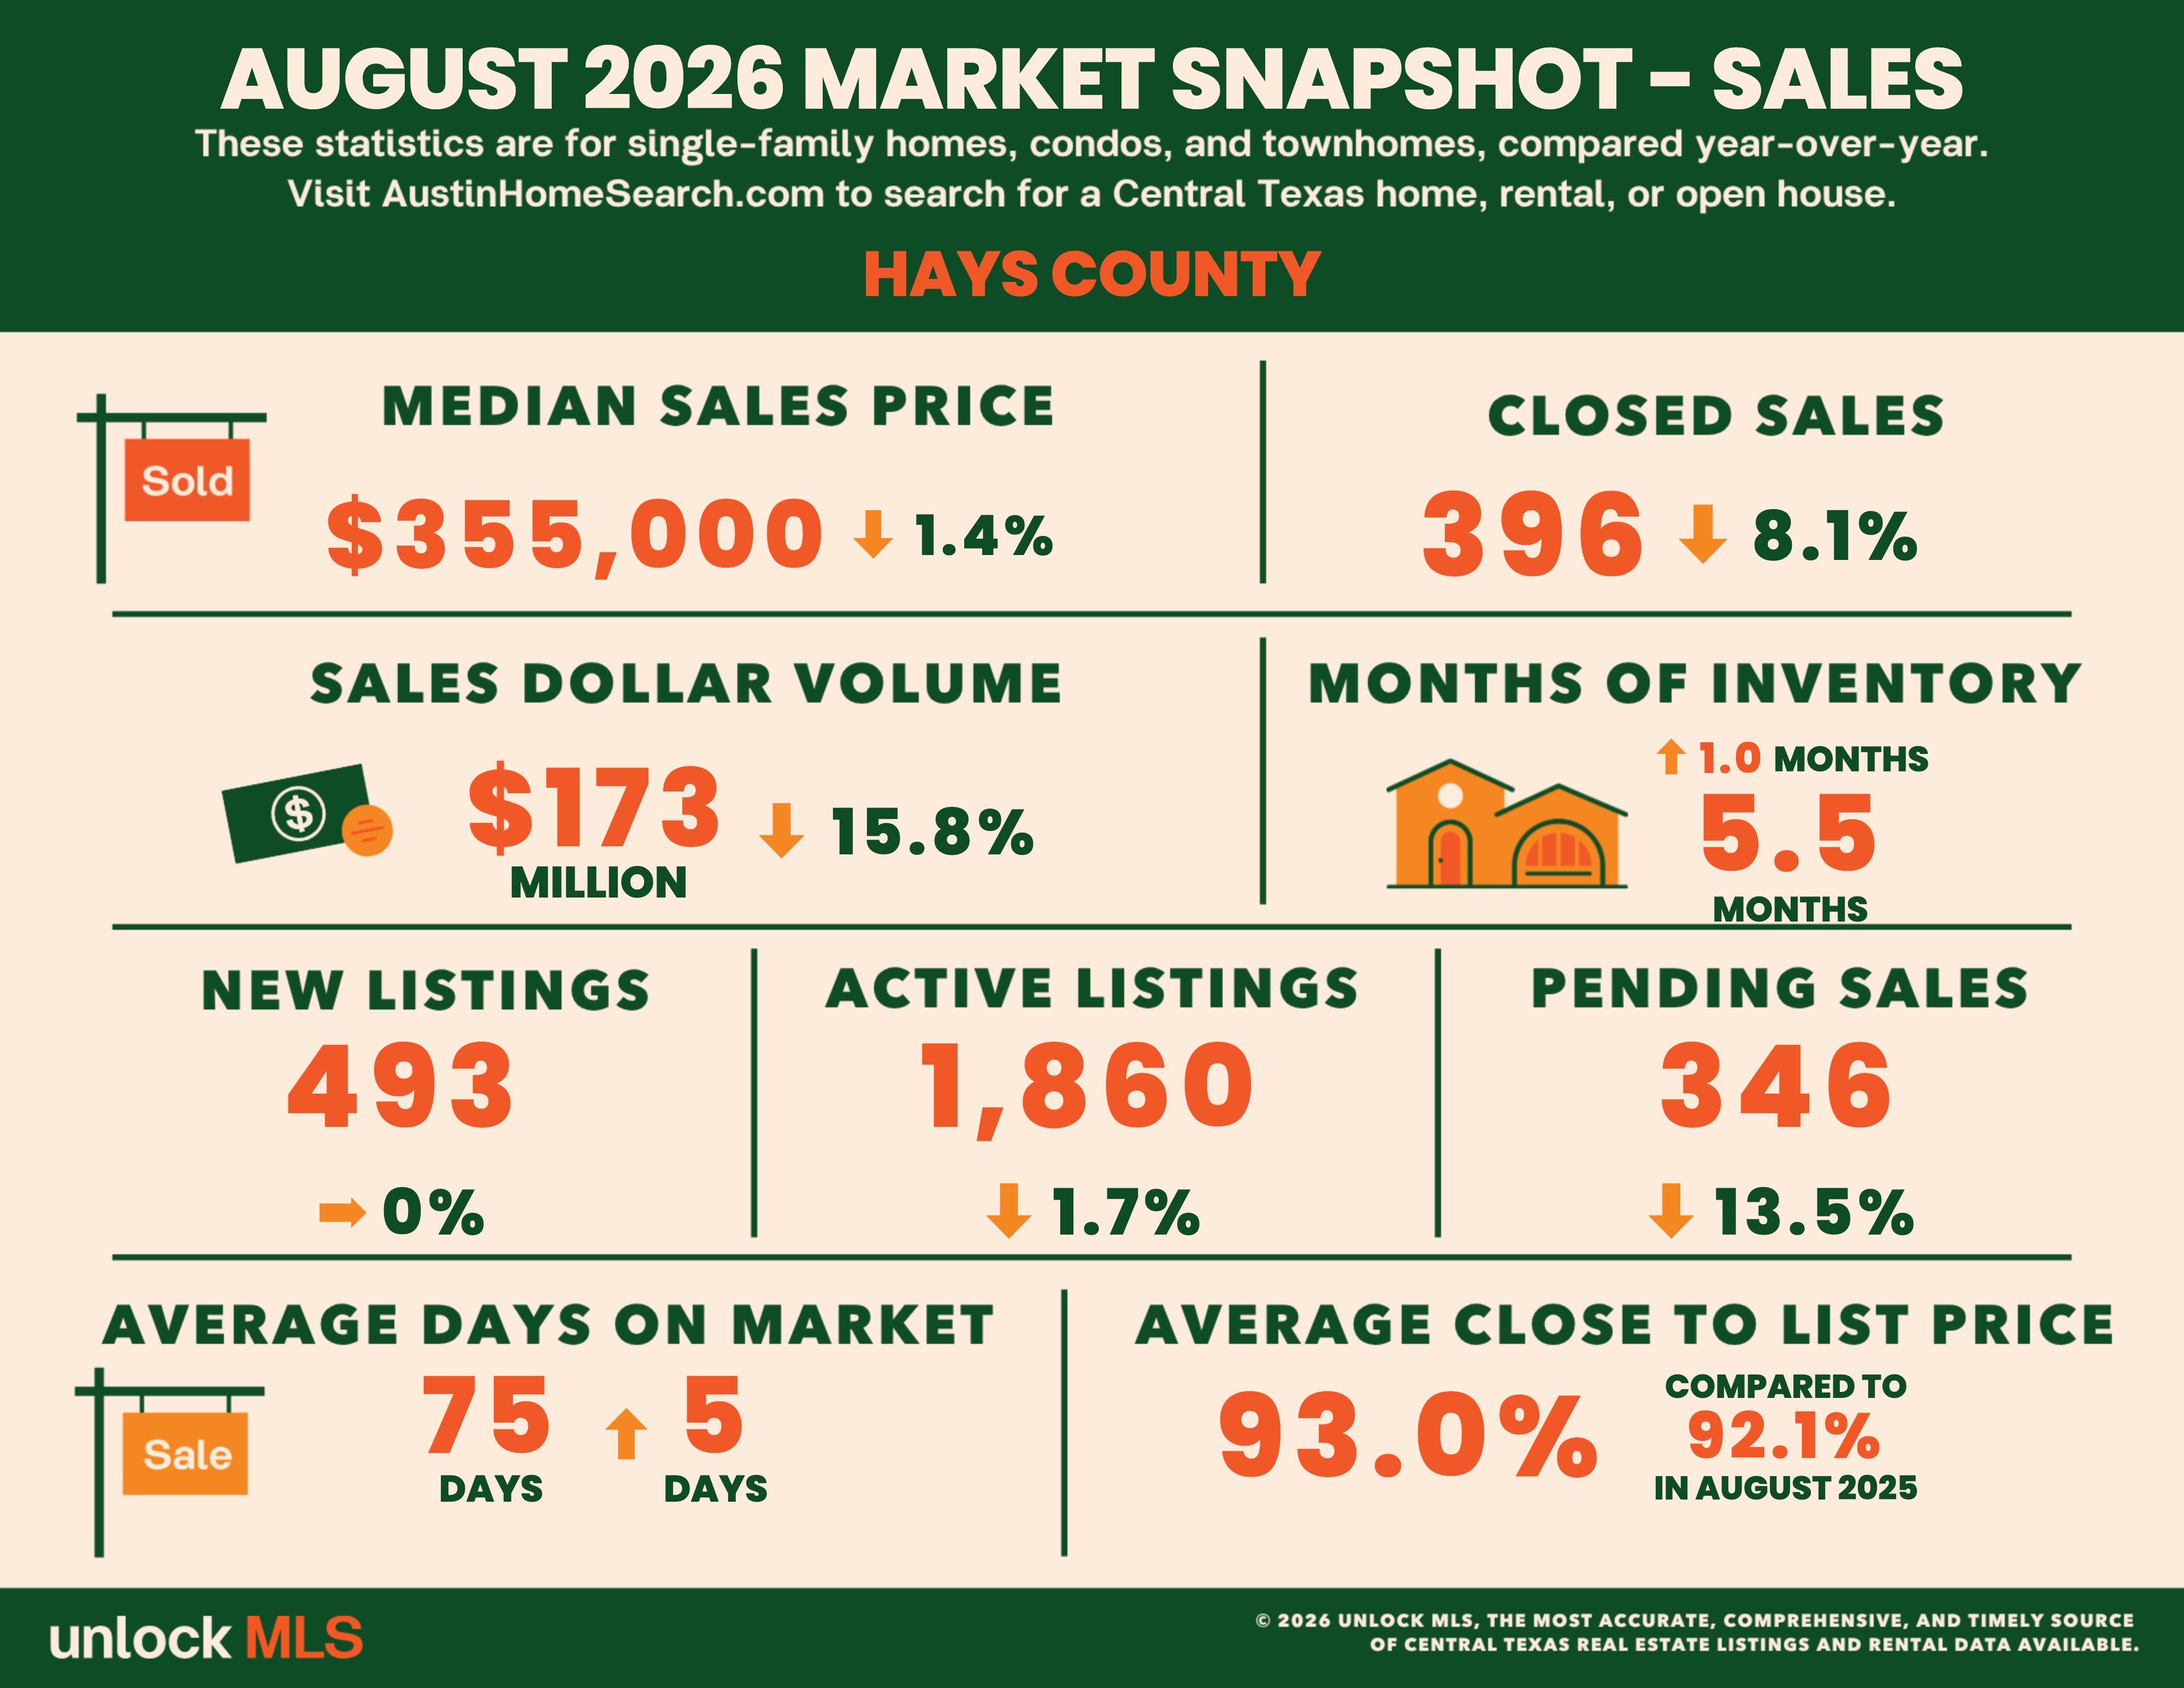
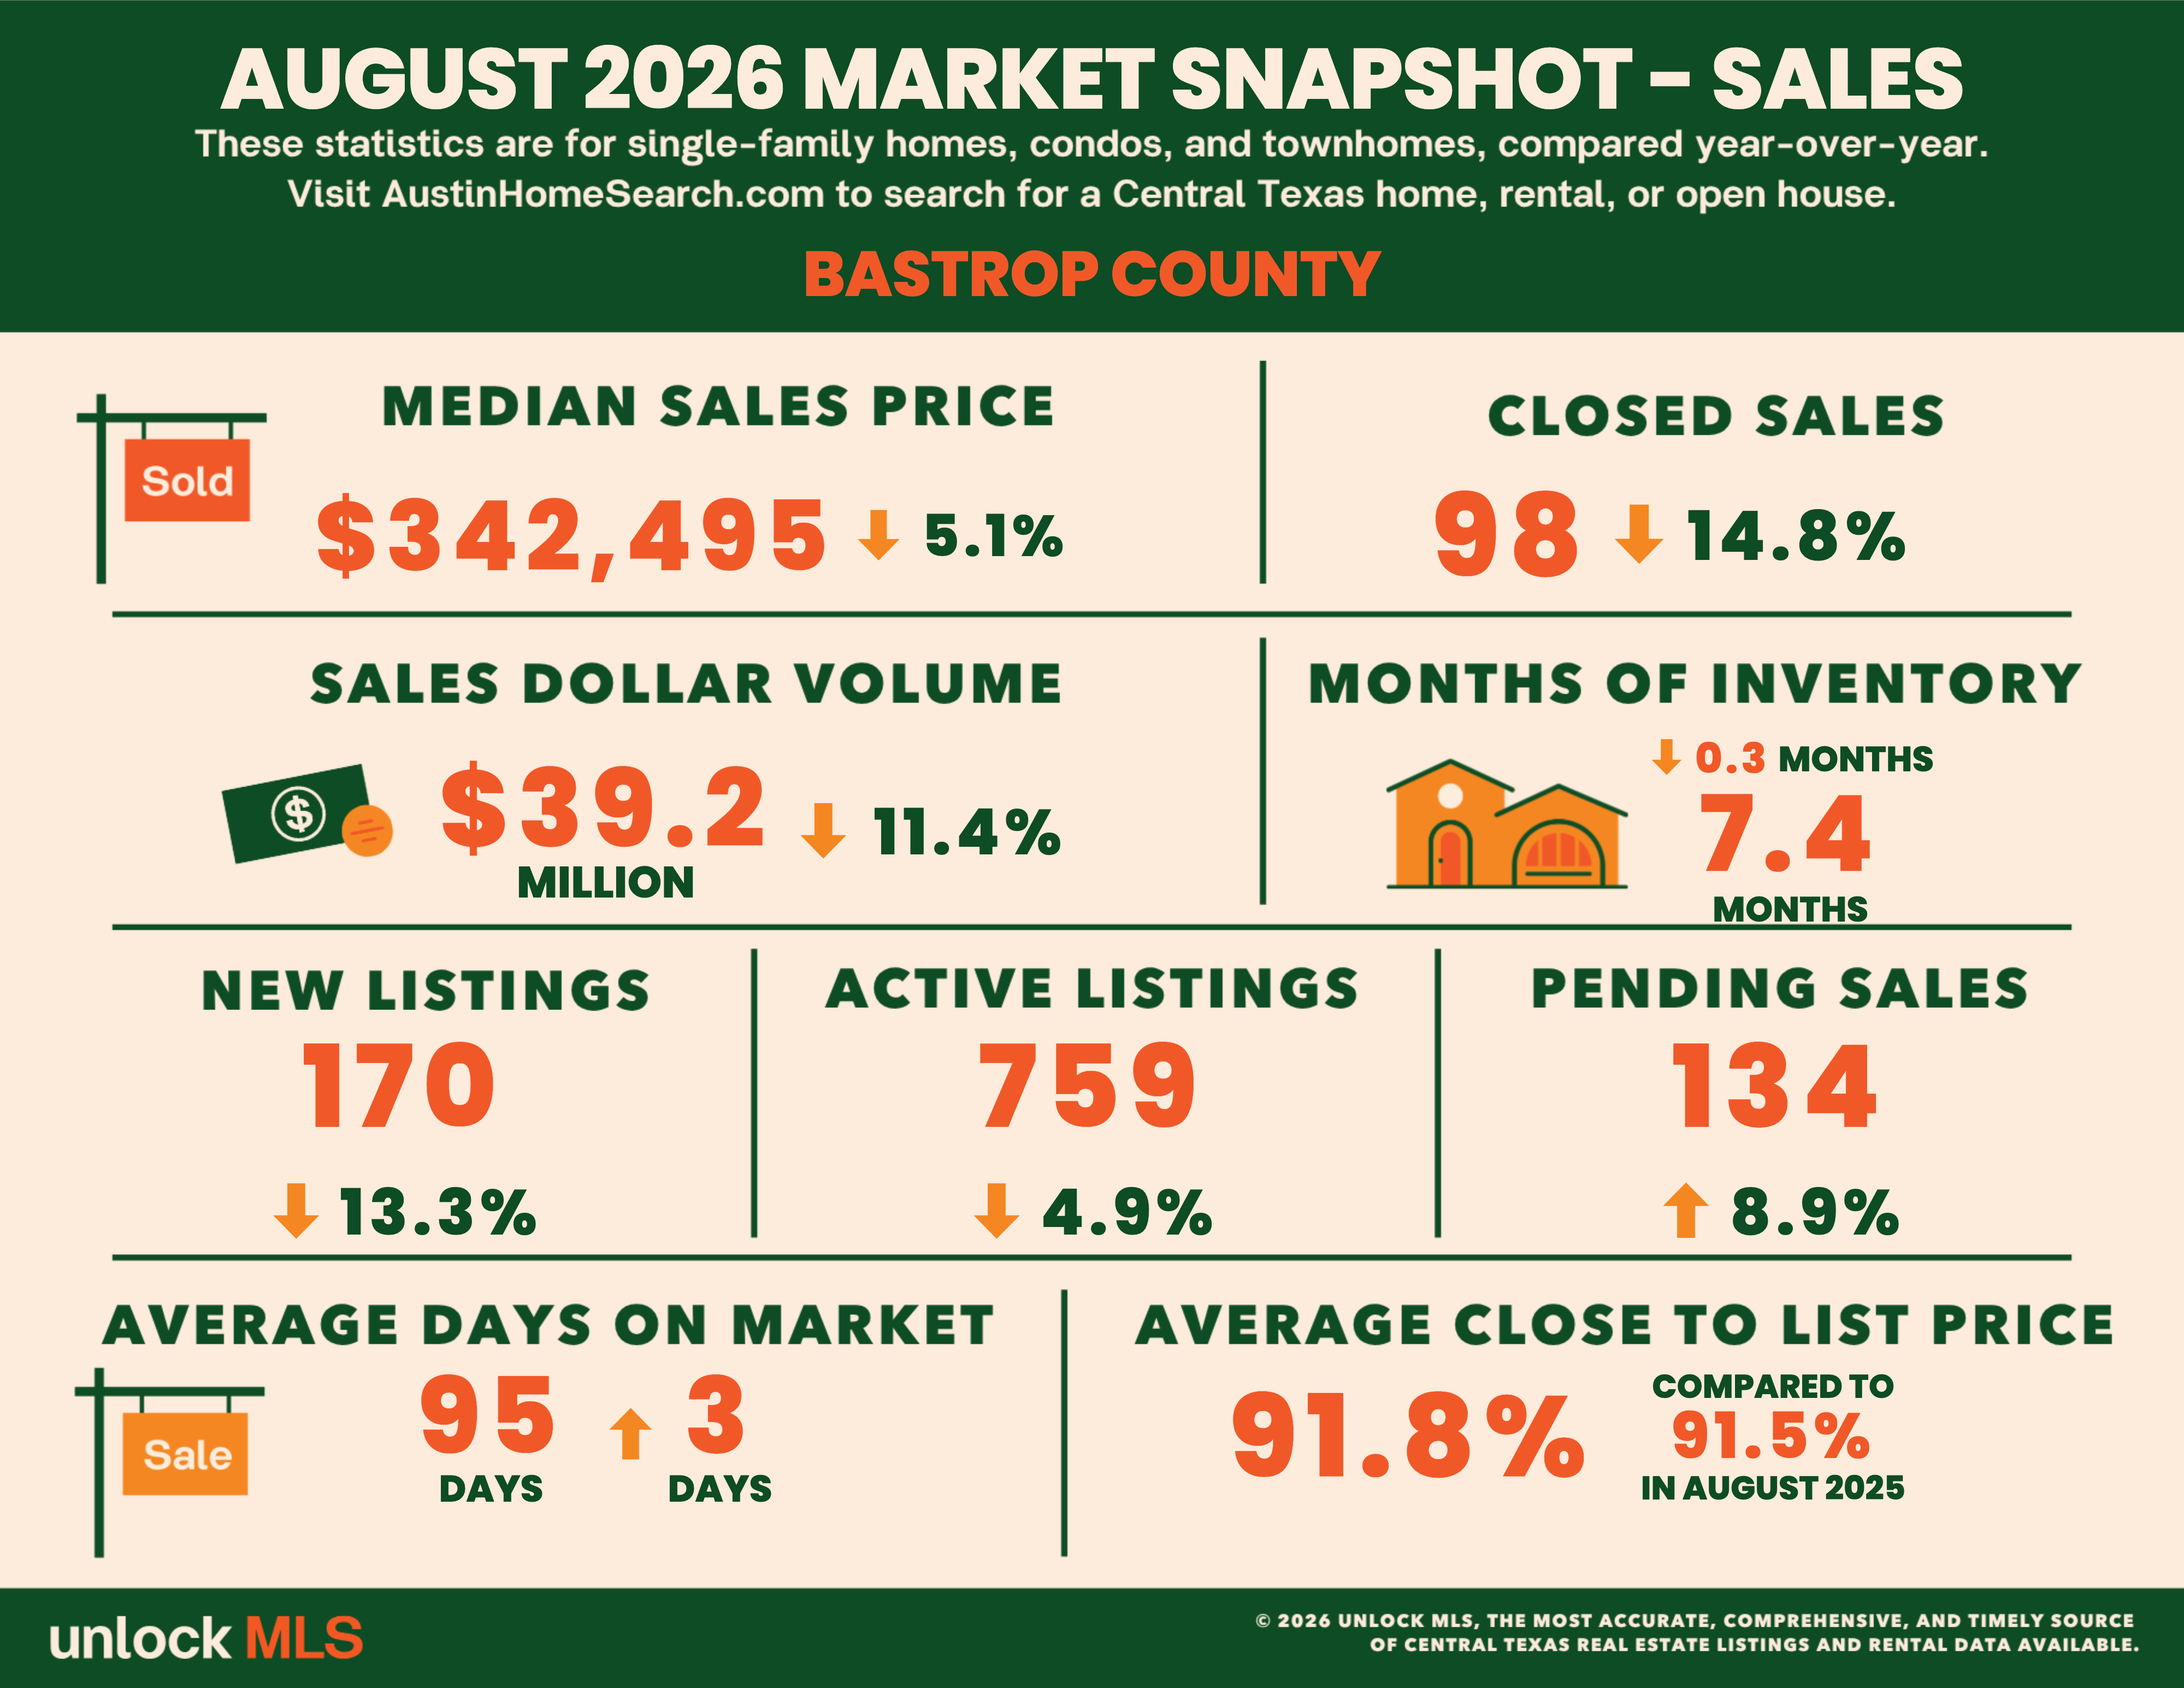
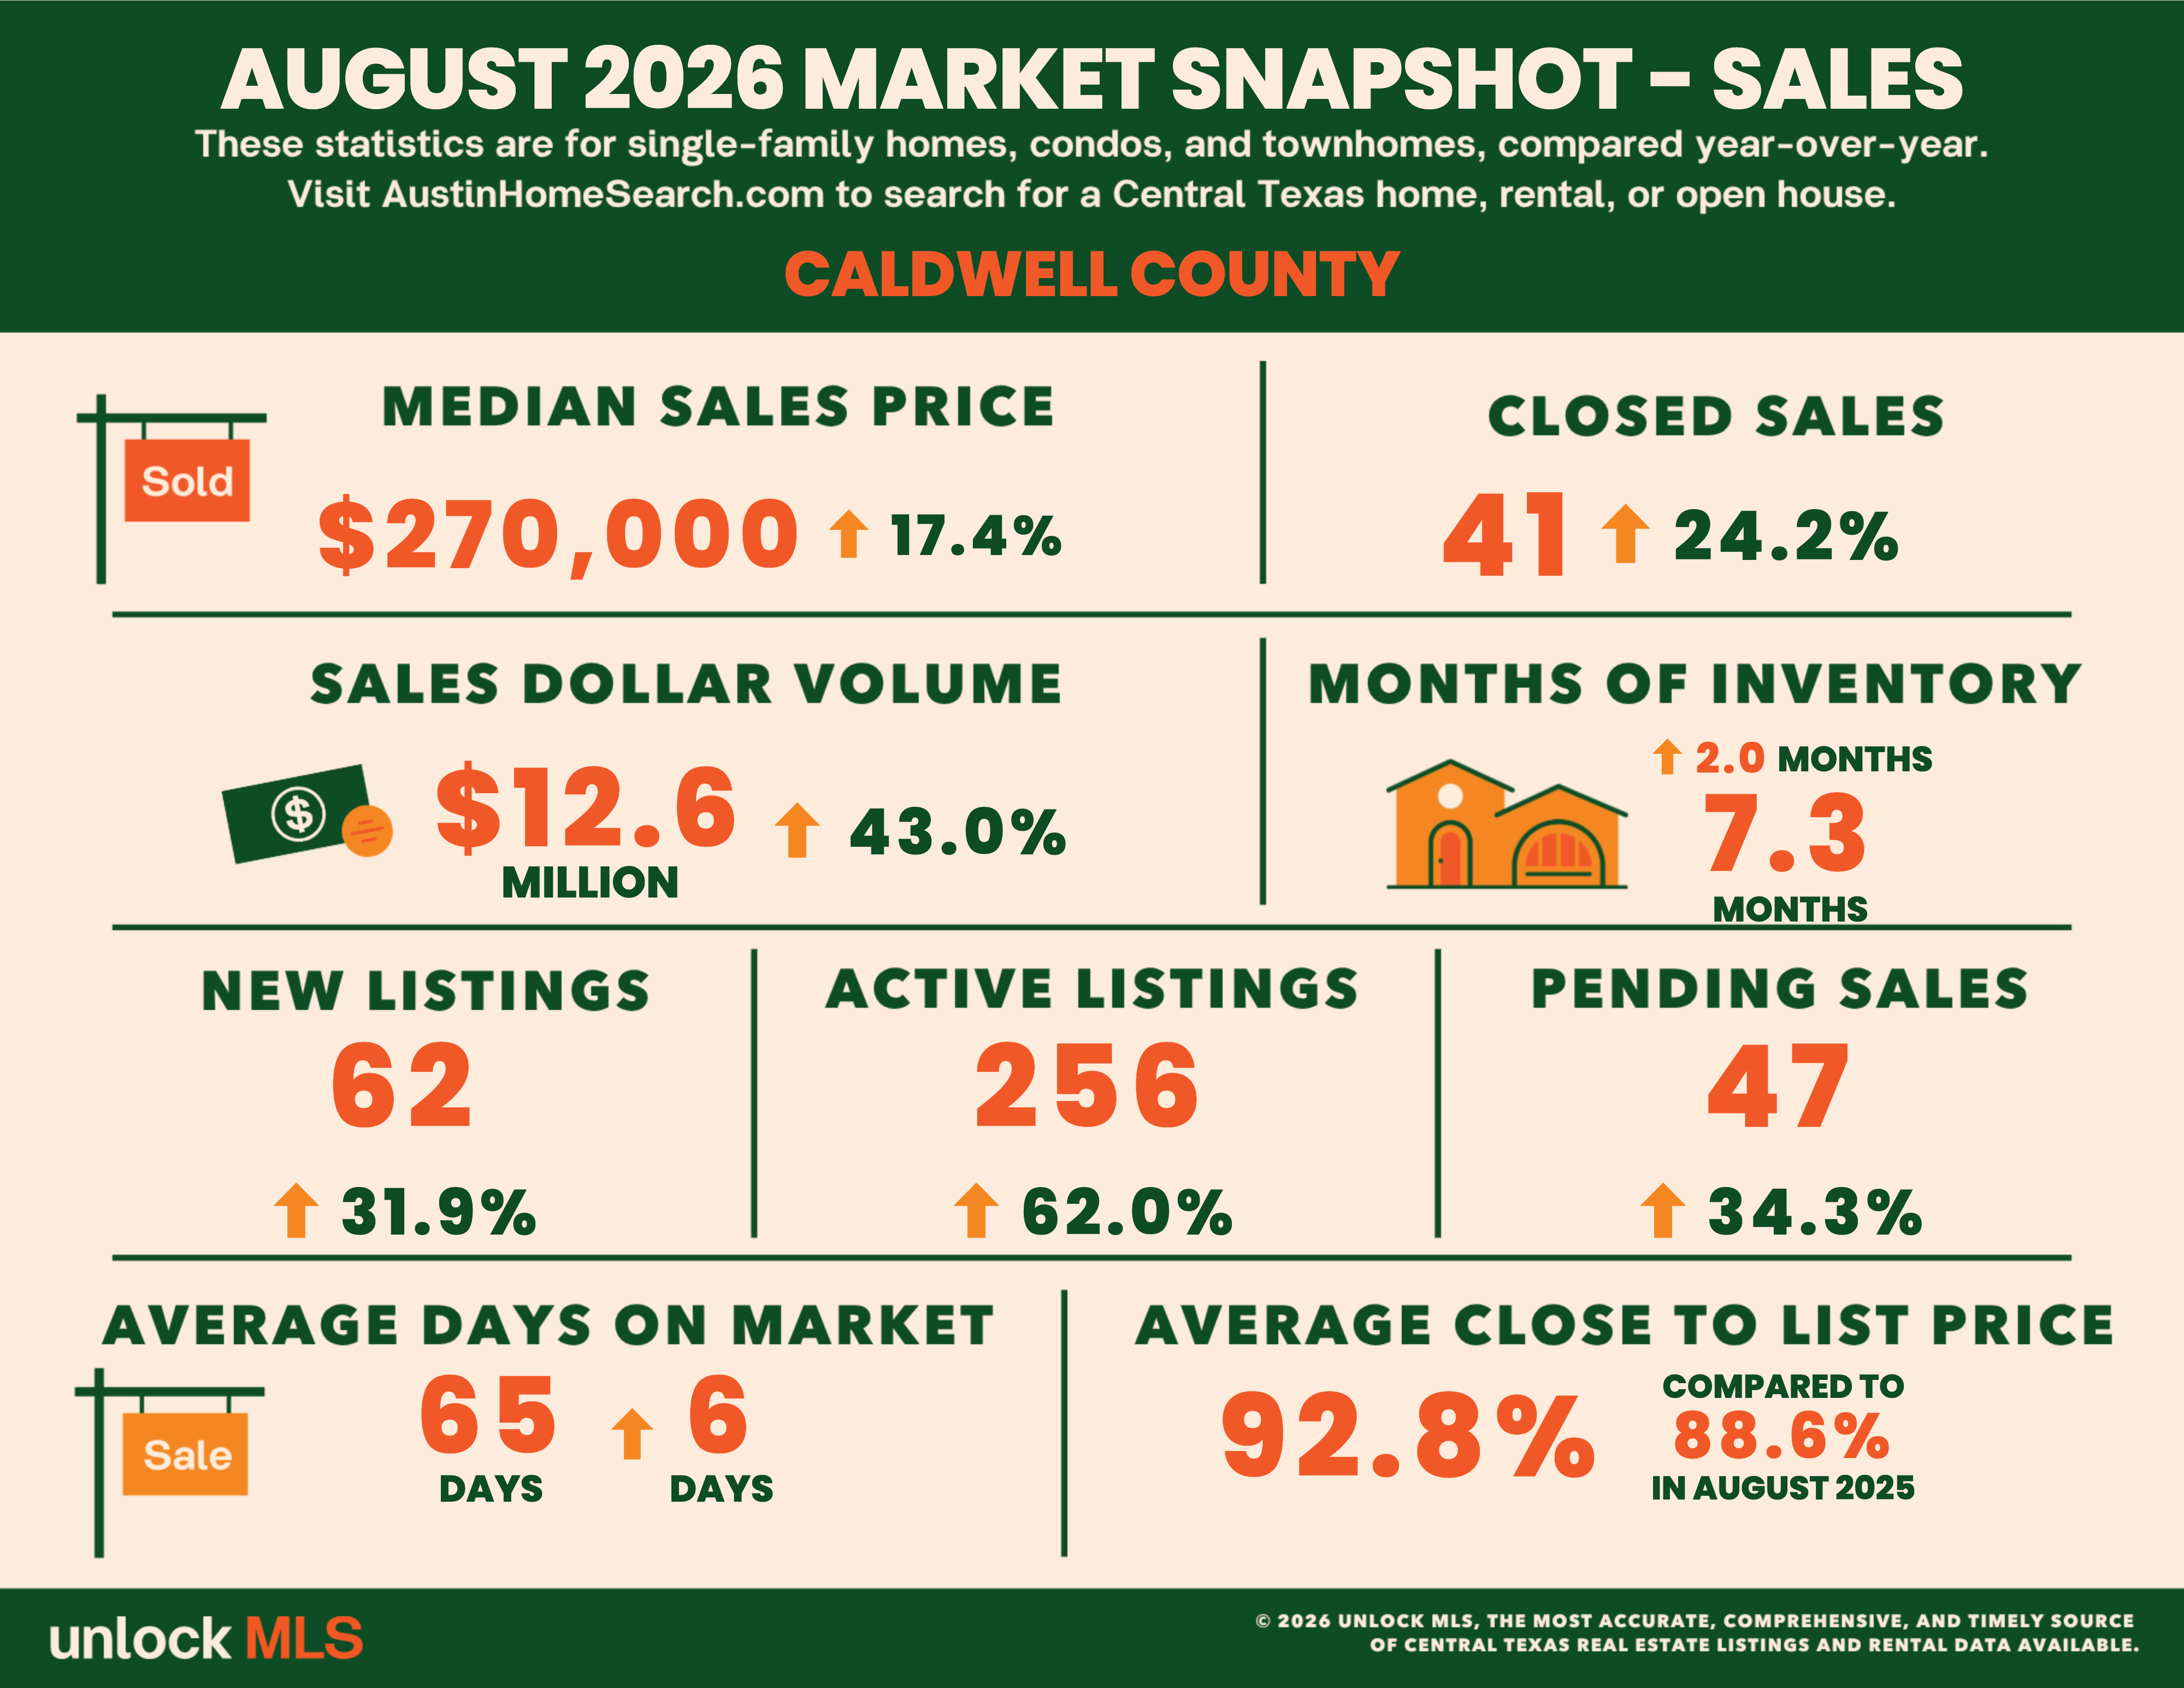
There are plenty of similarities across the counties, but a few meaningful differences. For instance, the number of Pending Sales was up in Williamson, Bastrop, and Caldwell counties, but down in Travis and Hays. Listing Inventory — the number of homes for sale — increased only in Hays and Caldwell counties. Along with those changes, Days on Market decreased in Travis county and was flat in Williamson county, but increased slightly in Hays, Bastrop, and Caldwel counties.
Separately, I’ll summarize the first three quarters of 2026 soon using my Market Dashboard and data provided by the Texas Real Estate Research Center at Texas A&M University. For now, I’ll summarize by saying that it has been a challenging year for residential sellers and buyers in the Greater Austin area and in much of the United States. See Stagnant Market Continues and National Housing Market: Price Drop Insights for comments in recent months.

 Bill Morris on Austin Real Estate
Discussion
No comments yet.