I write frequently about market conditions and changes over almost 35 years in my Market Dashboard, but Jeff Osborne, Broker/Owner of RE/MAX Capital City presented some charts in a recent company meeting that I think capsulize our experience over the past 10 years. The charts I include in this post are built on MLS data, so they undoubtedly understate New Home sales somewhat. Otherwise, this information very accurately shows what home sellers and buyers have experienced.
First, here’s a look at annual home sales:

On the left, the number of sales of resale and new homes are summarized. The chart on the right combines those market segments. We saw the run-up of the resale market in the early years of the Covid pandemic. What many were not as conscious of was the steep decline in the supply of new homes during those years. That sharply constrained the total supply of homes and drove the bidding wars and steep price appreciation that we saw in 2021 and much of 2022.
The chart below shows that most homeowners who purchased in 2020 or before have gained substantial equity since then. It also shows why some would-be sellers who purchased more recently may be frustrated in their efforts.
Now, compare the number of annual sales in the first chart above to this look are new listing activity over the same years:

As the total number of homes sold declined by more than 23% from 2021 through 2024, the number of listings added to our inventory has grown annually. The number of new listings in 2024 was the highest in the ten years shown, while the number of closed sales in 2024 was still lower than the total in 2018!
As that imbalance grew in recent years, the “days on market” for closed sales soared from less than 20 days in 2021 to almost 70 days in 2024:
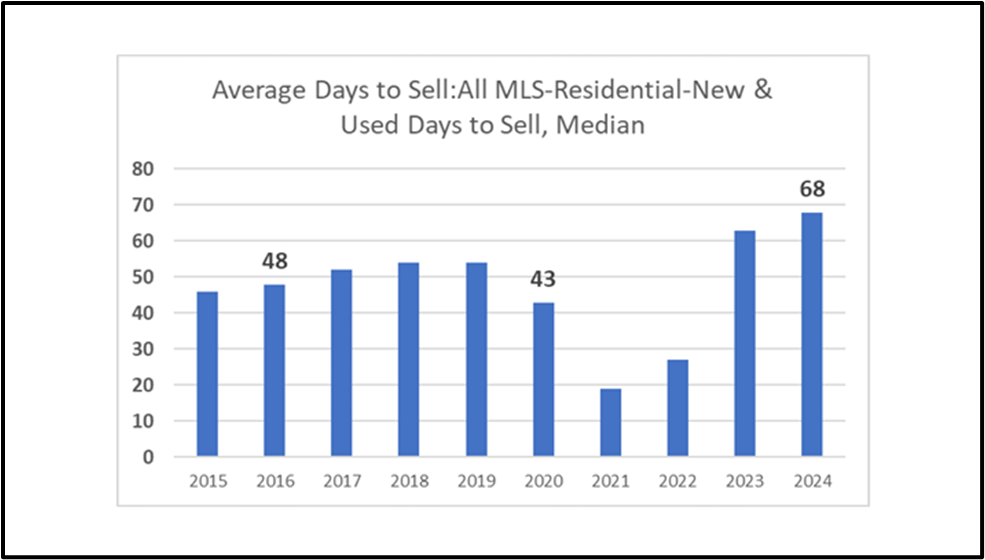
It’s worth noting that 68 days to sell wasn’t especially unusual before this very unusual market cycle, but more than tripling the time to sell has surprised some sellers over the past couple of years.
These two charts highlight the supply-and-demand environment that we’ve seen during the past two years::
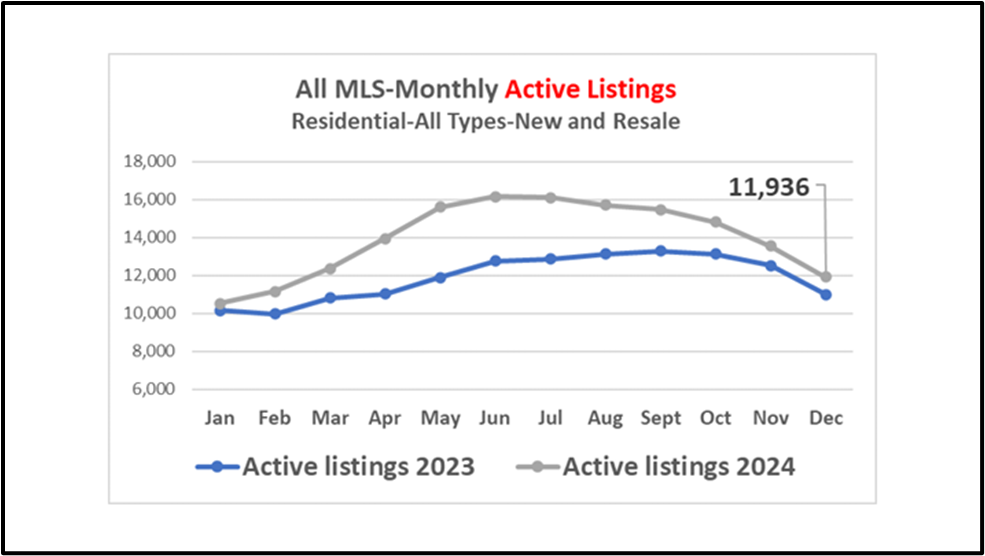
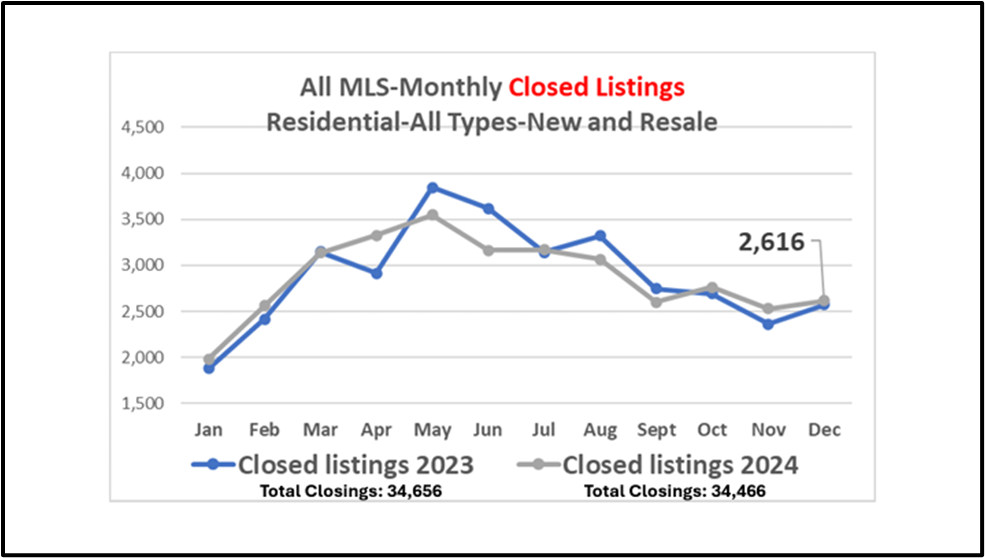
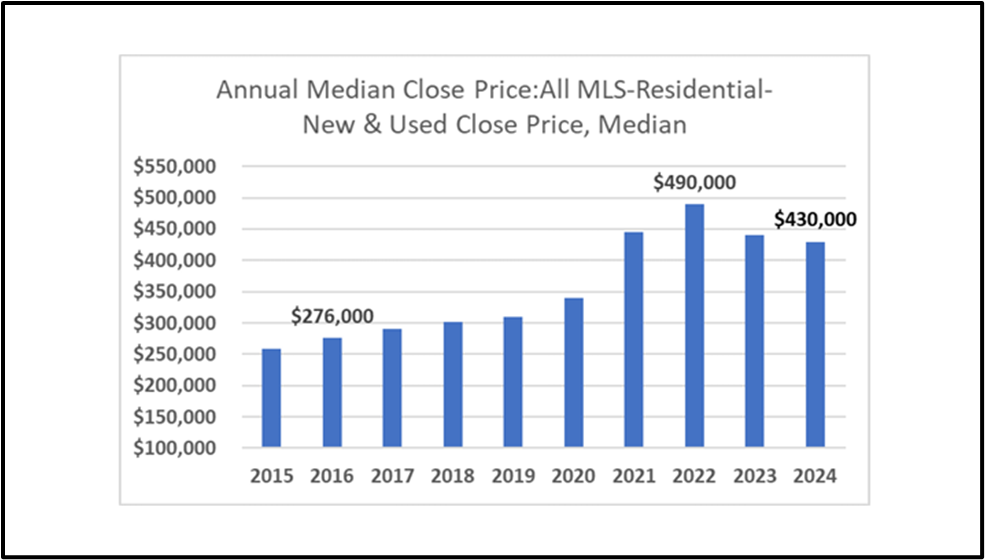
The growth of inventory in the first half of 2024 compared to the previous year is obvious, but the number of closed sales did not grow with the supply, leading to this result in home prices:
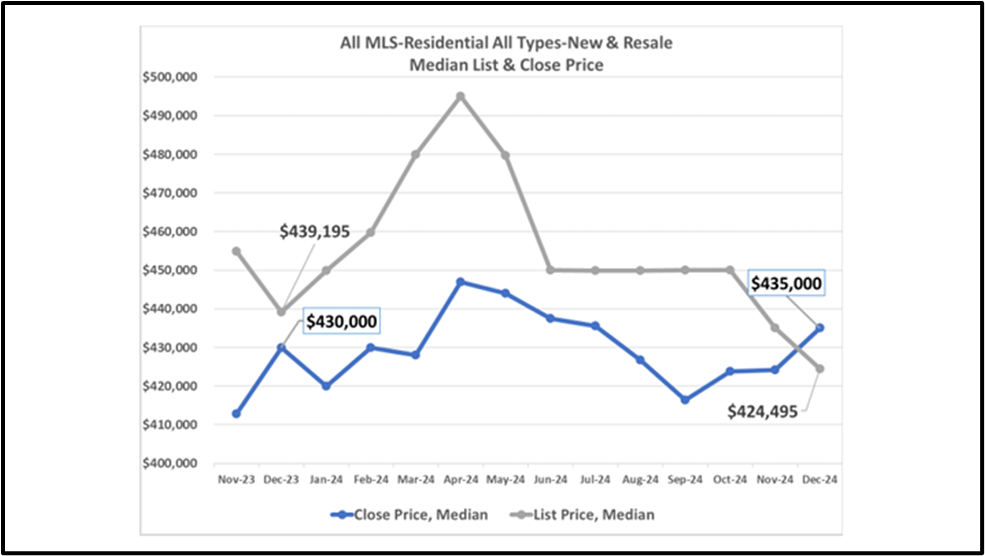
Sellers were slow to adapt to the changing conditions, and you can see their ultimate reaction in the 4th quarter of 2024, with the median list price last month lower than the median sale price.
In the coming days, I’ll have more to say about this market situation using data from the Texas Real Estate Research Center, but I greatly appreciate Jeff sharing these important charts as we begin 2025.

Discussion
No comments yet.