Last summer I posted a look at the distribution of home sale prices in the Austin metropolitan area (Update: Austin home price distribution). That view of prices through the first half of 2023 showed how the imbalance of housing supply and demand drove prices higher in 2022, and that market forces were calming the environment in 2023.
This chart updates that data through the end of 2023 and includes a longer view — the end of the Great Recession, the transition into the current market cycle, and the pandemic period with the pricing distortions:
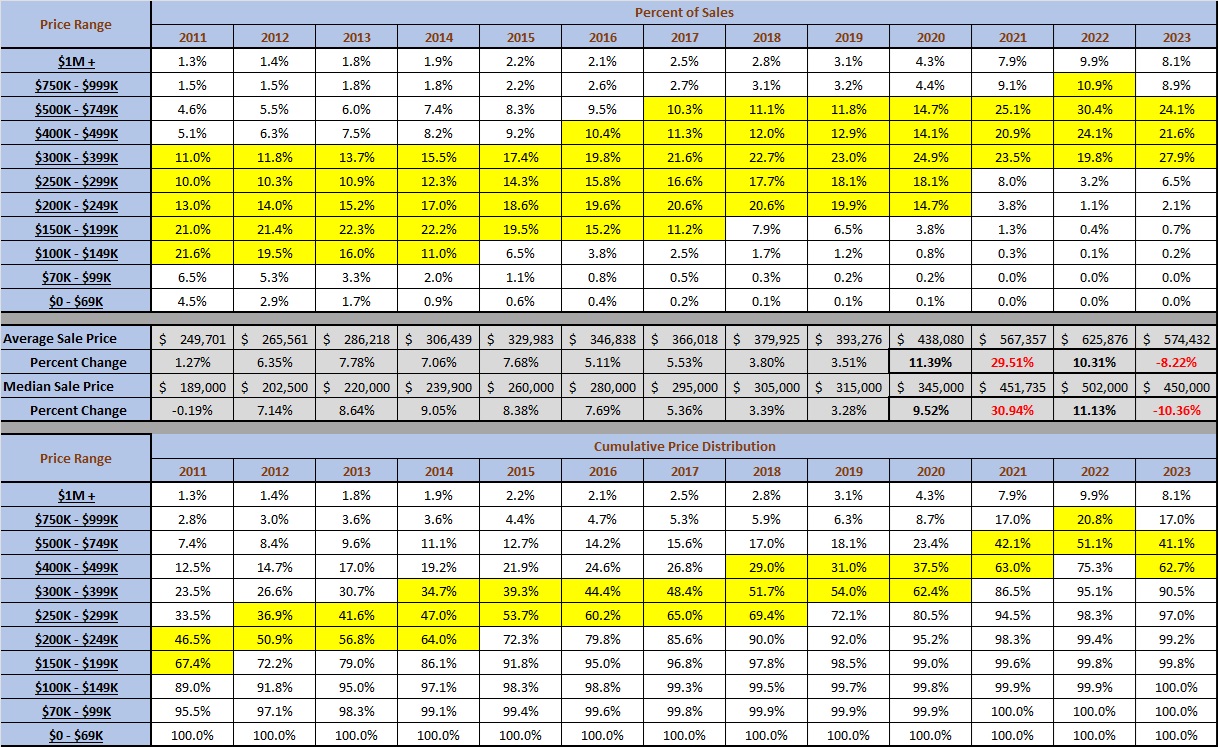
The upper portion of that graphic displays the percentage of all home sales each year that occurred in the price ranges stated on the left (houses, condominiums, and townhouses). I have highlighted the price ranges that represented 10% or more of all sales in each year. Clearly, previous years in this cycle have seen price growth but only in 2022 did the $750,000-to-$999,999 range represent more than 10% of sales.
The bottom portion of the graphic shows the cumulative percentage of sales from the highest to the lowest price range, with the price ranges that included the median and average sale prices each year. In both the top and bottom grids it is evident that 2022 was an anomaly. The average and median prices and year-to-year changes shown in the gray rows in the middle of the graphic show that the most dramatic price changes actually happened in 2021, that 2022 was year of more moderate growth, and that 2023 saw falling prices compared to the previous year.
Finally, look at the highlighted cells in both the top and bottom grids for 2021, 2022, and 2023 and note how very similar the distributions were in 2021 and 2023. As I wrote in Market Dashboard Update and Resale Market Changes — what a ride! our regional market has been seeking balance in 2024. That transition is not yet complete, but I am involved in the market every day and I will keep reporting on progress.

Discussion
No comments yet.