At the end of this post, I’ll add one chart to make an important point about home prices and home owners’ equity during this over-long market cycle. As background for that, my complete market dashboard appears below.
The important feature of the top chart (Market Activity) is the red circle, highlighting that between September 2020 and April 2022, more homes were sold than were listed acrose the 5-county Austin-Round Rock MSA. That extreme imbalance between supply and demand led to unprecedented inventory absorption shown in the second chart (Unit Sales/Listings), and that erosion of housing supply produced the dramatic price behavior shown in the bottom chart (Market Price Movement),
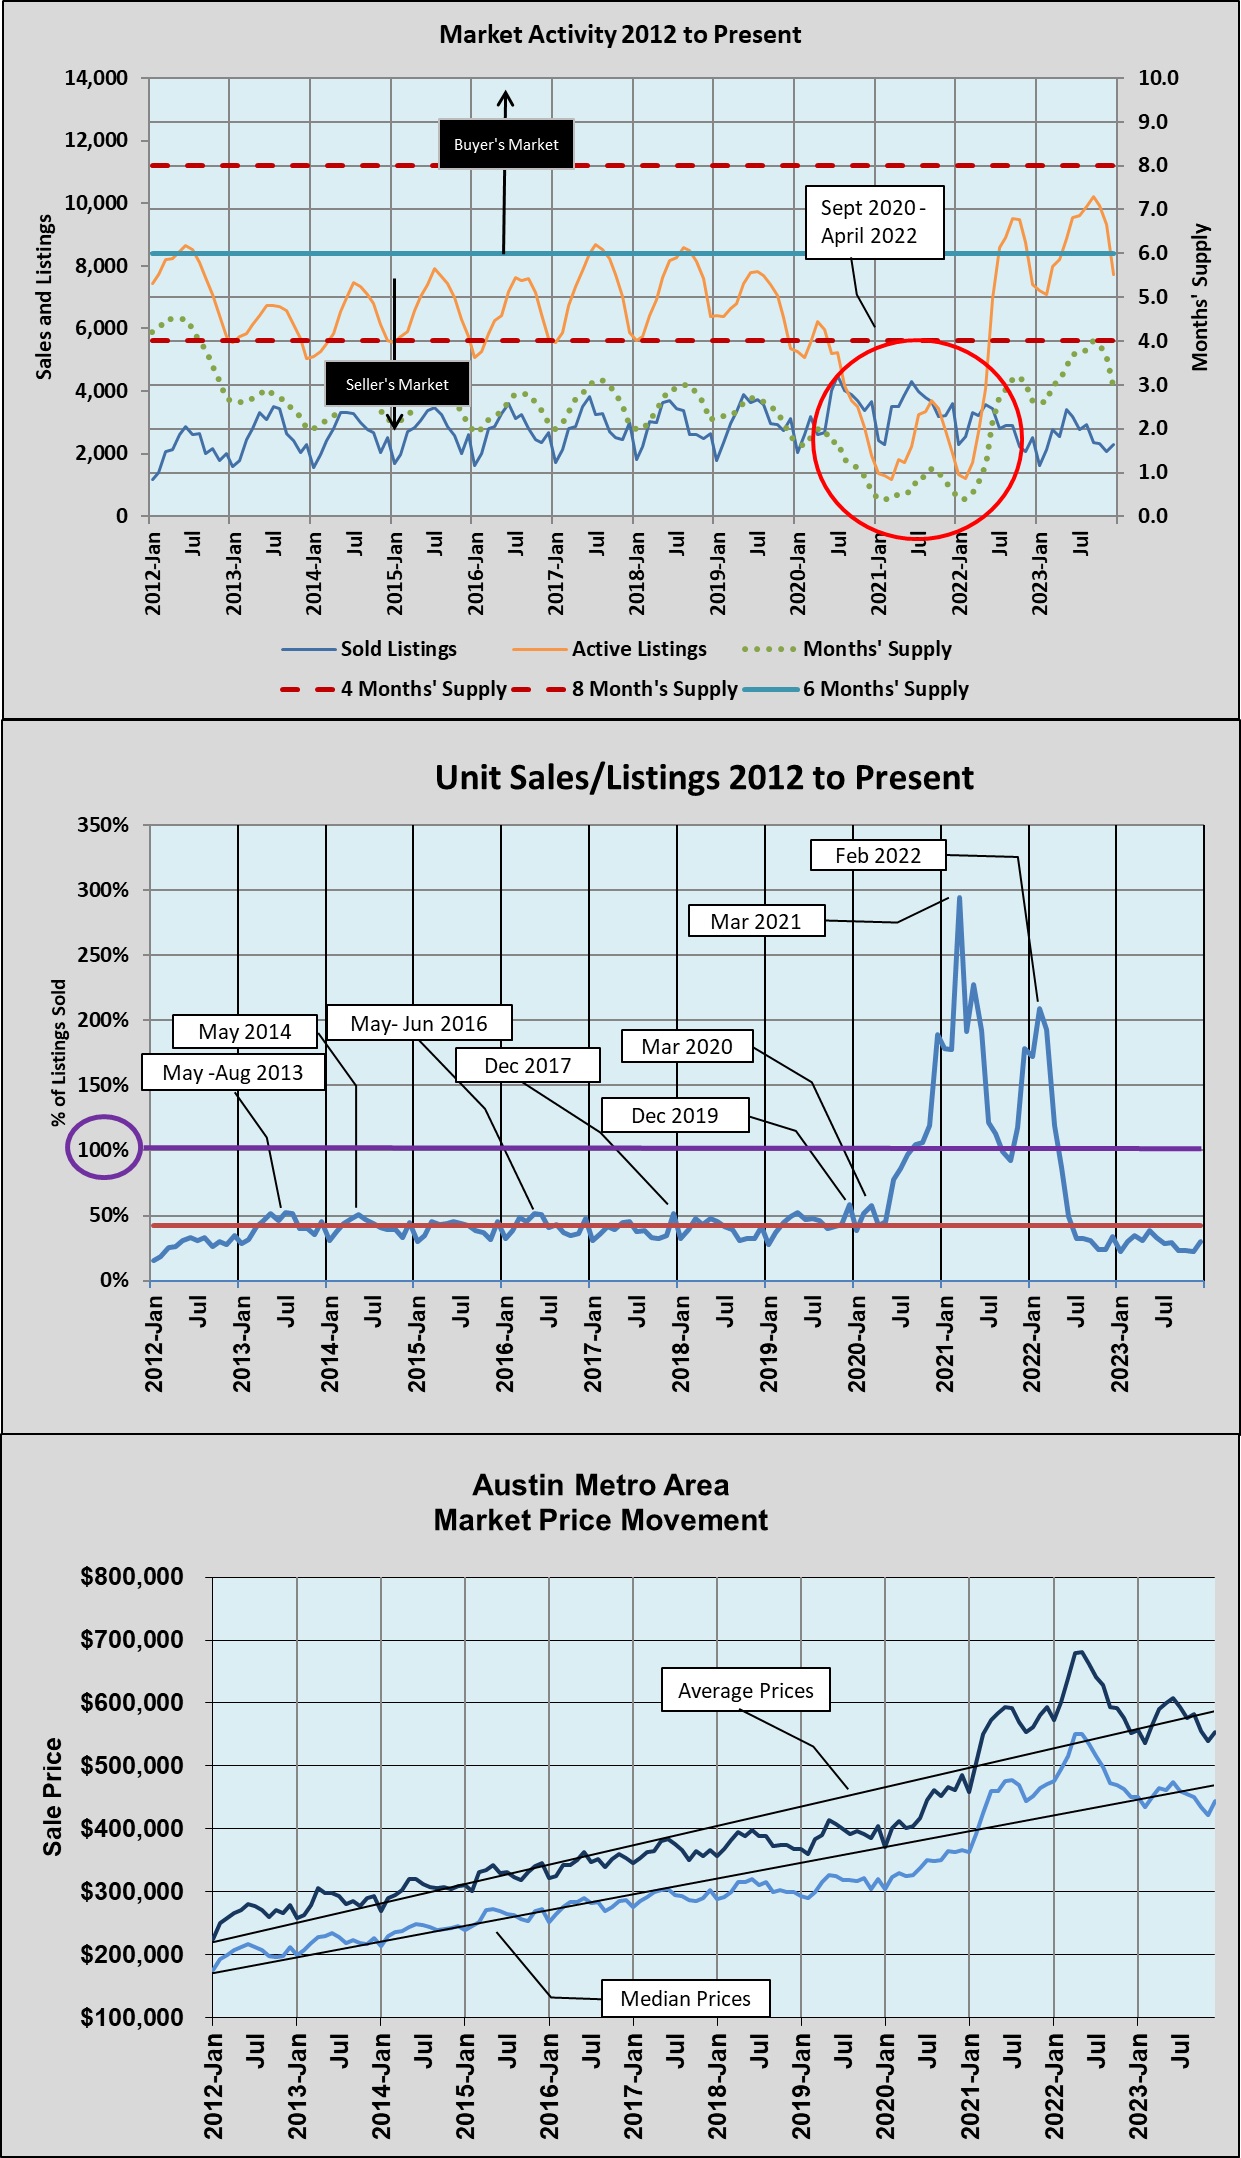
It is worth noting that there were hints of that market distortion earlier. For example, instead of the usual Spring/Summer selling seaon for residential real estate, the annual sales peaks in 2017 and 2019 happened in December. The bottom chart, however, shows that selling prices remained generally flat during that period, began to rise in the first few months of the pandemic in 2020, and then turned sharply upward at the beginning of 2021.
That leads to the chart that I mentioned at the beginning of this post:
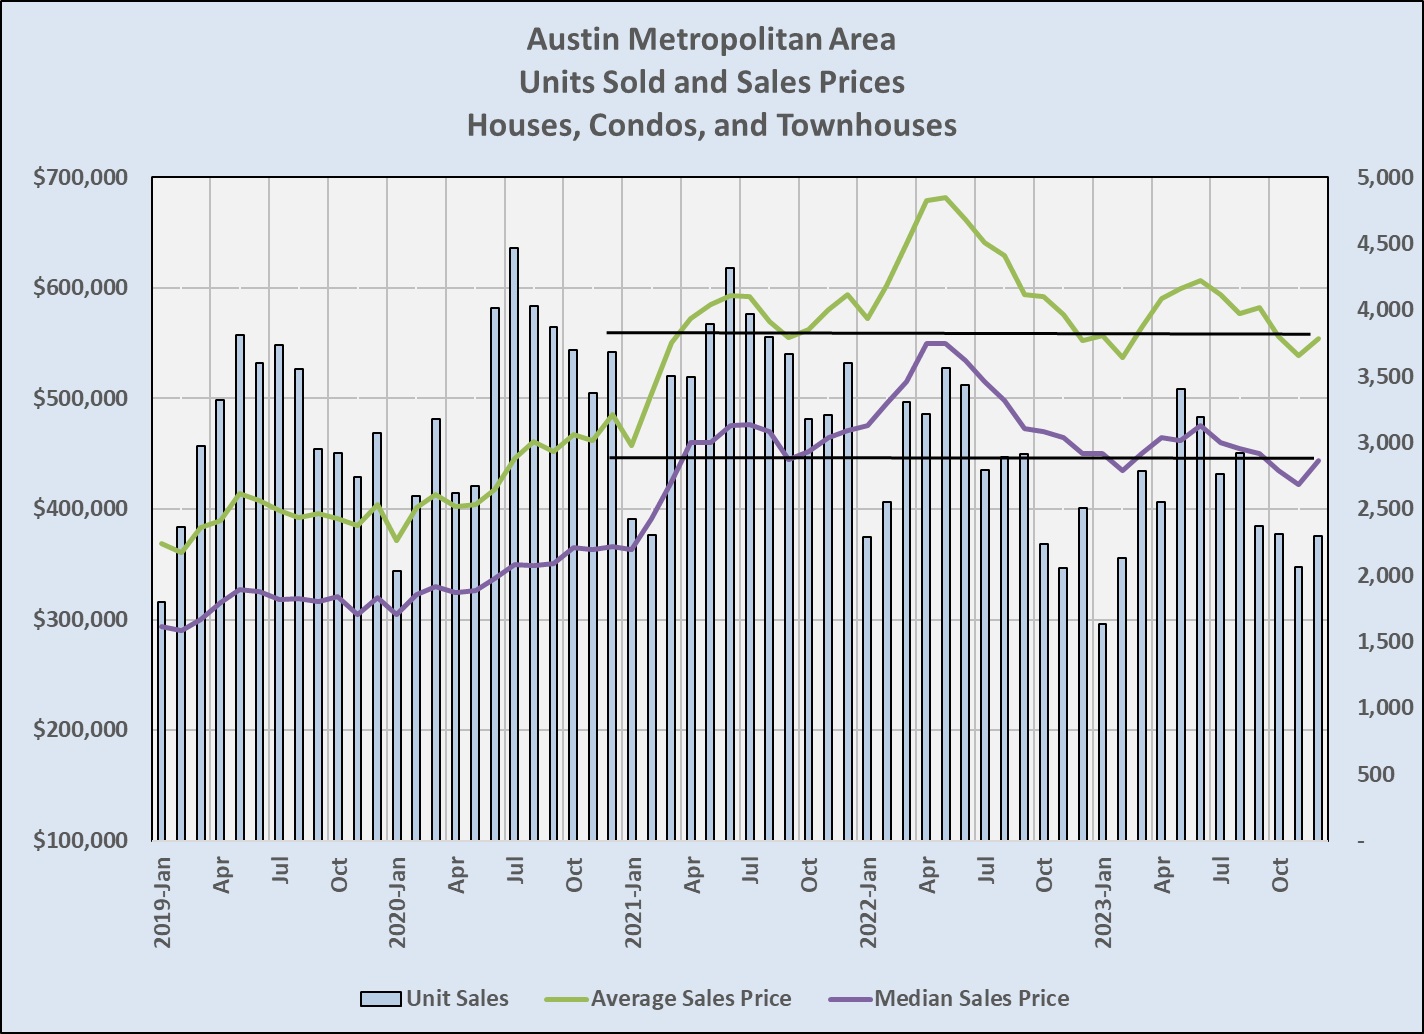
This last chart focuses on the past five years. The number of houses, condos, and townhouses sold peaked in July 2020, as the pandemic began dominating our attention. Unit sales declined each year since then. The sharp upturn in sale prices happend in January-February 2021, and if you were in the market in any way at that time you remember the frantic activity we saw in April-May 2022. The bidding wars continued for another few months, but the year and a half since then have been more difficult and unpredictable.
If you purchased a home in 2021 or 2022, you may well have negative equity in the property at this point, but most owners of residential properties in our metropolitan market gained substantially over the years shown. The horizontal black lines indicate the average and median sale prices in December 2023, which were about the same as February 2023, September 2021, and March-April of 2021. But the average and median prices in December 2023 were 50% higher than in January 2019, just five years earlier! (And had been rising steadily for six years before then.)
2024 will likely remain more unpredictable that we would prefer, but with pent-up buyer demand and with a dramatic build-up of home equity over a small number of years, we should see growth in resale listing inventory this year. In addition, home builders should gain some ground, even in a challenging environment. Analysts who watch the mortgage market generally expect interest rates to flatten or decline a bit this year. Financial markets are gaining confidence and showing real growth for the first time in almost three years, and recession fears seem to be moderating. We should see a stronger year in 2024, and I’ll keep you informed.

Discussion
No comments yet.