It has been about two months since I wrote Market Dashboard — transition toward “normal, focusing on a shift in the Austin-area residential real estate market that began March-April of 2022 and led to a vastly different and unpredictable market environment over the past year.
I remind that this market cycle has been very different from everything else we’ve experienced over more than thirty years. One of the clearest ways to see that contrast is the ratio of unit sales (houses, condos, and townhouses) versus the number of listings each month since 1990:

Over that 33-plus year period, the horizontal red line shows that an average of 34% of active listings were sold each month. But notice that before 2013 the average was much lower. That figure was 22%. 2012 was the year we emerged from the “great recession,” and 2013 was the first year of the current market cycle. With rare exceptions, absorbtion of active listings was above that red line since 2013, and was driven to a much higher average of 60% by the frantic period in 2020, 2021 and early 2022. In March of 2021, our market actually sold three times as many homes as we listed!
That supply-and-demand imbalance had obvious impact on home prices:
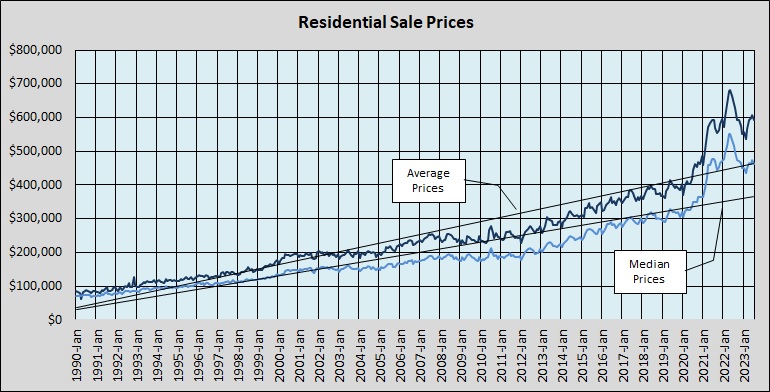
In less than three years, sales prices were driven far above the long-term trend lines. Focusing on just this market cycle looks better:
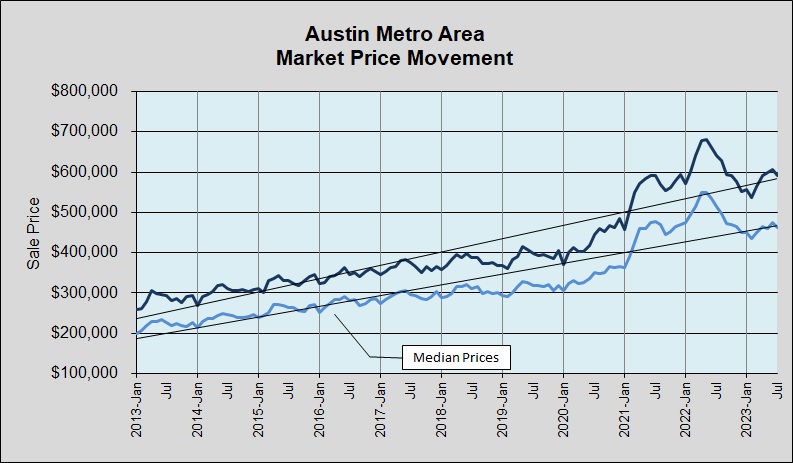
In that chart you can see that in 2023 both median and average home prices are back to the trendlines for this 10 1/2 years but they are rising again.
Now, just one last view of these market conditions:

Just as you saw in the first chart above, the highest sales prices since 1990 were in April 2022. But in this last chart it’s clear that the largest number of homes sold was almost two years earlier, in July 2020. Even with declining sales we continued to consume inventory, reaching just 2 weeks’ supply of active listings in the 1st quarters of 2021 and 2022. In July 2023 we had 3.7 months’ supply of homes on the market, still far below “normal” but the highest since 2012!
As I suggested in June 2023, this ia a market in search of stability, and there have been (and will be) ups and downs. Unit sales were flat from July 2022 to July 2023, and prices are appear to be settling from the wild activity in from January 2021 through April 2022. In February 2023, Days to Sell averaged 53 days, the longest time in more than 10 years, and in July it was still 36 days (versus 10 days one year earlier). This unpredictable environment is not resolved yet, but these are good signs for the future.

Discussion
No comments yet.