If you follow me at BillMorrisRealtor.com or CentralTexasHomeSearch.com, you may know that I have maintained and updated a set of data for many years — collectively I have referred to as my Market Dashboard. The entire dataset goes back to January 1990, and I’ll share that long-term view again in the coming months, but for today I just want to highlight the current (very long) market cycle, and where we are now, after emerging from the pandemic years.
This chart shows just how different 2020 through 2022 were from what came before, and since:
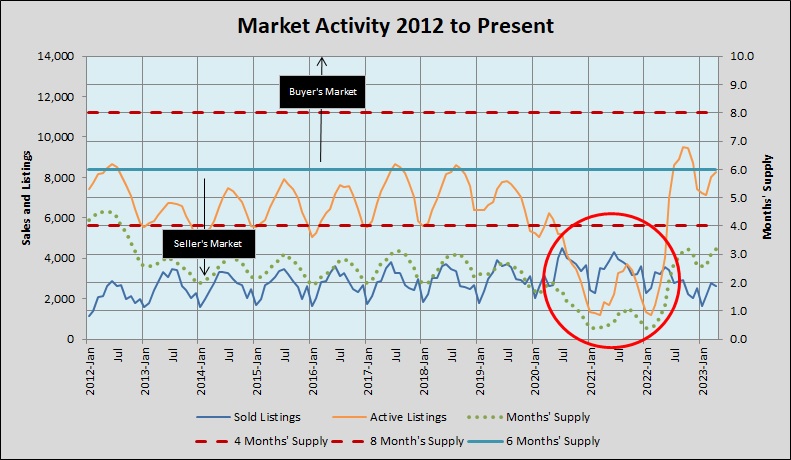
2012 was the year that activity climbed back from the last market trough, setting the stage for what is now 10-plus years of boom market conditions. The blue horizontal line shows the 6-months’ supply that we have long considered “normal” housing inventory for sale. The green dotted line shows actual inventories during this time, with seasonal inventory peaks at about 3 months. The red circle focuses on the Covid era. Note that the number of homes sold exceeded the number listed in most months from the middle of 2020 through the 1st quarter of 2022. During that time inventories were consistently below 2 months, and in early 2021 and 2022 our 5-county metropolitan area had as little as 2 weeks’ supply!
You can see that even more clearly in this graph:
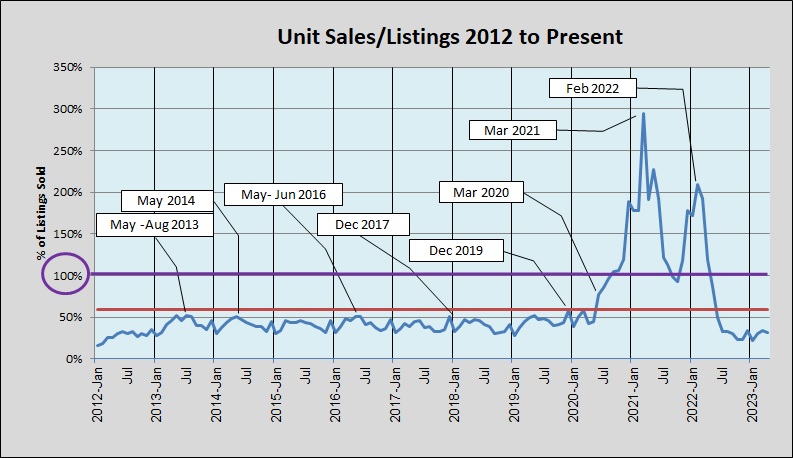
The purple horizontal line is an important point of reference, where the ratio of homes sold to homes listed is 100% — sales and inventory are equal. In March 2021, that ration almost reached 300%, and as recently as February 2022 it was over 200%! (The red line shows the average inventory across the entire market cycle.)
Predictably, that supply-and-demand imbalance pushed prices upward:
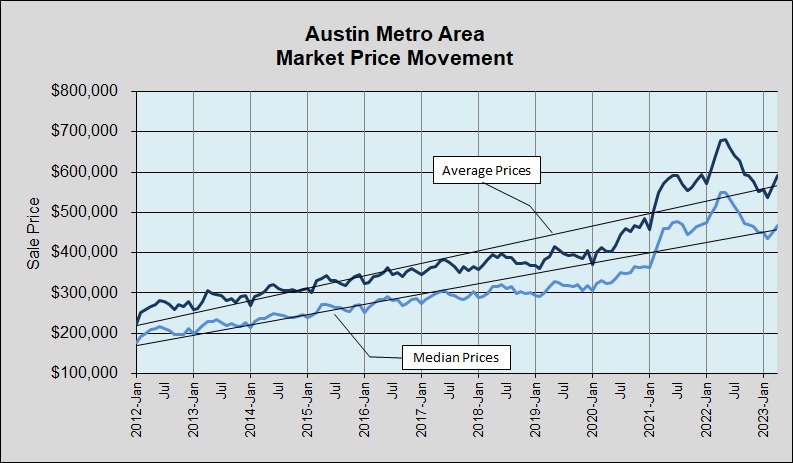
If you were participating in the market, especially in 2021, you saw the rash of multiple offers, truly irrational bidding wars, and may have known home buyers who brought tens of thousands of extra dollars to closings because appraisals didn’t support inflated contract prices and mortage approvals. Median and average sale prices peaked in the first half of 2022 and fell for the rest of the year, but note that by April 2023 average prices were back to the peak of 2021.
We are seeing real momentum in 2023, tempered by continuing low inventories and mortgage interest rate about twice what they were during the rush in 2021-2022. As always I will keep watching and reporting on our market. I expect that we’ll continue to see some ups and downs, but trending upward generally.

Discussion
Trackbacks/Pingbacks
Pingback: Update: Austin home price distribution | Bill Morris on Austin Real Estate - July 6, 2023
Pingback: Focus on change | Bill Morris on Austin Real Estate - August 18, 2023
Pingback: The continuing search for balance | Bill Morris on Austin Real Estate - August 27, 2023