A few weeks ago I promised to update my market dashboard through June. I’ll add some comments later about the dashboard and about what how our market behaved January-June 2019. To start, here are the primary metrics I have watched for many years:
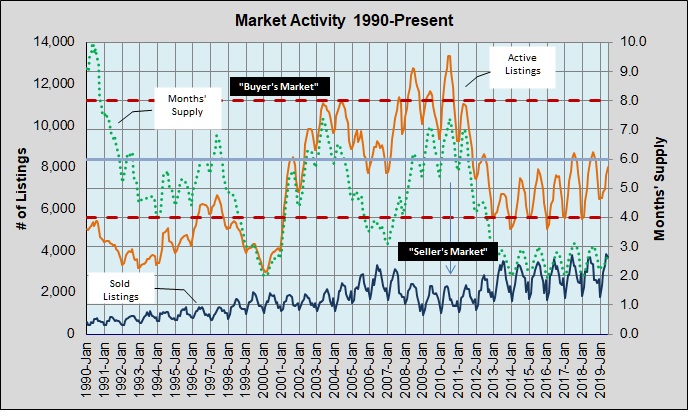
The first chart isn’t as complicated as it looks. The orange line is monthly listing inventory. The blue line is monthly sales. Months’ Supply (green dotted line) is how long the inventory will last at that sales pace. Most market economists consider 6 to 6 1/2 months’ inventory “balanced.” I used 6 months and bracketed it at 4 months and 8 months because as supply moves beyond those levels it becomes readily apparent that we’re in a “seller’s market” or a “buyer’s market.” As I have mentioned in the past, we are now in our seventh year with 3 months’ or less listing inventory — solidly in seller’s market territory.
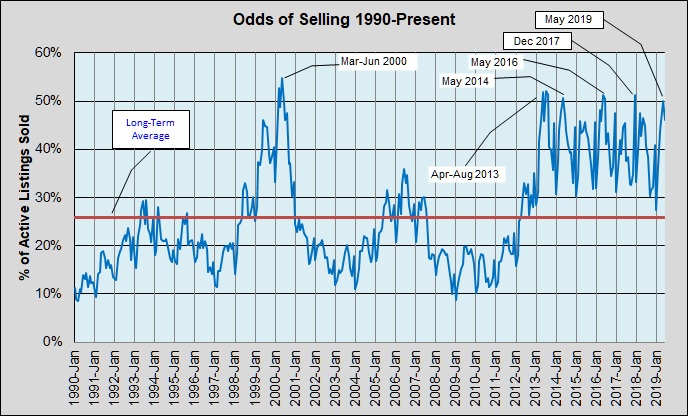
You can see that supply-demand imbalance in the second chart: In 45 of the last 78 months 40% or more of all active listings sold. In 8 of those months 50% or more sold. In January 2009 that metric was at a low of 8.8%. It hit 52% twice, in May and July of 2013. For comparison the average across all 29 1/2 years was 26%. The median was 22%.
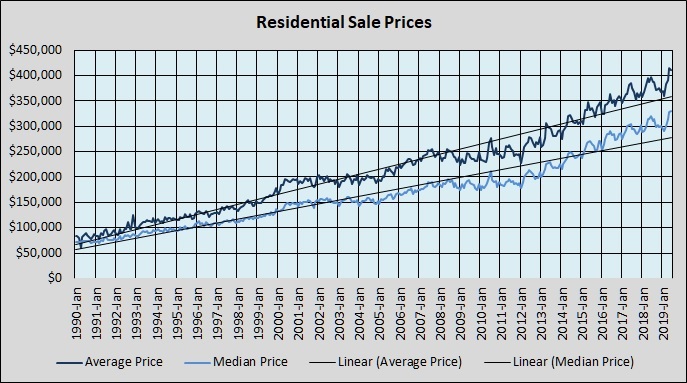
Now compare the last two charts and you’ll see — as you should expect — that in soft market conditions (i.e., lower Odds of Selling) home prices were below the long-term trend line (with a slight lag). In times of stronger market conditions home prices rise above the trend line. That’s where we are now.
But let’s zoom in on the past six months and on how that compares to previous years:
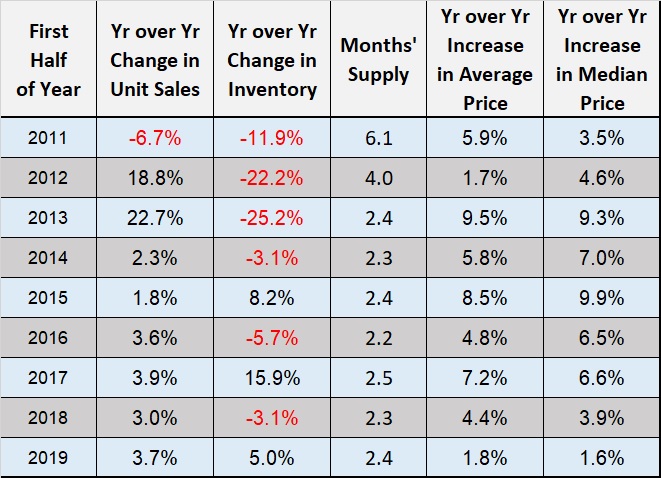
That table begins with 2011, just as the Austin market turned the corner into recovery from the last recession. We consumed inventory quickly in 2011, 2012, and 2013 and sales have been largely constrained by low supply since then. Then you see the seven years of significant under-supply. Notice too that the really dramatic annual price appreciation in 2013 – 2015 softened a bit in 2016, and as I’ve been telling you over the past year those annual price increases have abated noticeably, especially in 2019 — to less than 2%.
Unless and until the supply of available housing grows to meet demand, or something happens to stop our employment growth and in-migration, this is probably where we will be. There’s no reason to forecast a market downturn based on current market conditions in Central Texas, but increasing our housing supply is a very real challenge given the pace of our growth.

Discussion
Trackbacks/Pingbacks
Pingback: A quick follow-up: Austin growth | Bill Morris on Austin Real Estate - July 27, 2019
Pingback: Investing in Austin real estate | Bill Morris on Austin Real Estate - August 13, 2019