This Market Dashboard is a compilation of many key measures of market health that I began studying a few years ago and have found valuable in explaining circumstances in the Austin-area real estate market compared to news we have all seen and heard about the “national” market. Real estate is inherently a hyperlocal business, and even the area-wide metrics in this dashboard obscure significant differences between individual neighborhoods and property market segments. Discussions of nationwide market activity, while necessary and informative as far as they go, can create serious misconceptions about conditions in specific local markets. A recent blog post helps to highlight that issue: How Does Texas stack up in the Case-Shiller report?.
Printable (PDF) views of the complete Austin Market Dashboard are available if you wish (Market Dashboard 1990-Present and Market Dashboard 2005-Present), but I’ll comment on some highlights here:
The February market snapshot shows mixed results. The number of homes sold was up 14% compared to January, but was down 5% from February 2010. At that February sales pace, our inventory of 9,795 listings represents a 5.9-month supply — well balanced market conditions. (More on that metric later.) The median sale price was 2% higher than January, and 4.4% higher than one year earlier. At the same time the average sale price dipped 1.3% compared to January, but it was still 2.9% higher than February 2010.
One important point of emphasis regarding the Austin/Central Texas residential real estate market remains remarkable strength in property values. While local news reports, and my comments above, discuss month-to-month “blips,” it is important to recognize that average home prices here have continued to appreciate. In fact, filtering out seasonal and tax credit distortions, the 12-month rolling average price hit an all-time high in February:
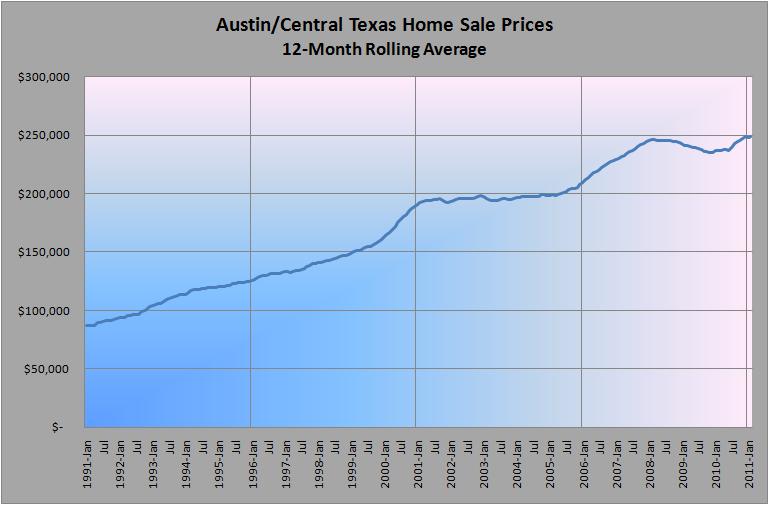
You can see that after the 2001-2002 market downturn that followed 9/11 and the Enron/Worldcom scandals, growth in this measure was very small. You can also see our own little “bubble” form in 2006 and 2007. Austin entered the housing downturn somewhat later than many other parts of the country but prices did stumble for most of three years, then began a steady recovery during 4th quarter 2009.
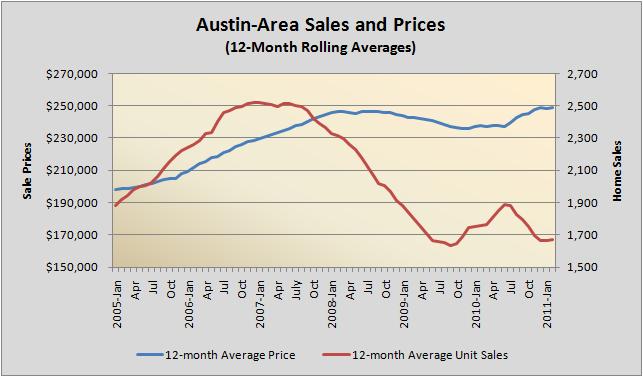
We have absolutely felt the housing crisis in another way — unit sales. But even as monthly sales fell from a peak of about 3,300 homes to a low of 1,000 — shown moderated in this 12-month average — prices remained remarkably resilient:
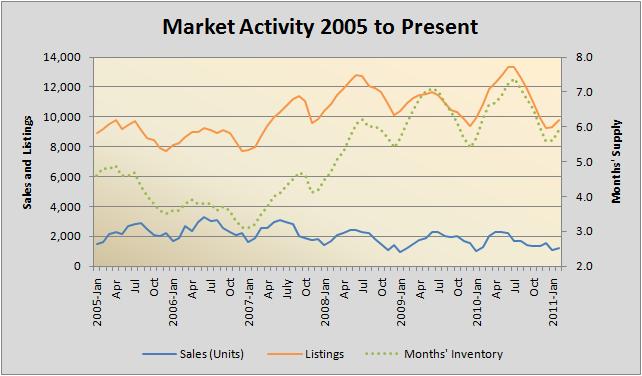
Growth in listing inventory is apparent, as is the sales slowdown, but the green dotted line shows that supply was rarely outside the “normal” range. (Most analysts consider about 6 1/2 months’ inventory to be a balanced market, with little upward or downward price pressure.) The highest we saw this market-wide metric was just over 7 months’ during the summers of 2009 and 2010. In truth, the most “out of bounds” supply-and-demand conditions we saw recently were in 2005, 2006, and 2007 when sales abnormally outpaced listings.
The fact that we have not seen the flood of heavily discounted foreclosures that other markets experienced has obviously helped. Moreover, the foreclosures we have seen tended to be concentrated in specific neighborhoods rather than impacting values across the board. (See Foreclosure Impact in Austin for more on that.) We were also helped by home builders being conservative and not building unsold inventory.
The Austin area has been fortunate, with rare exceptions, through several market cycles:

For a number of years I have been tracking another view of supply-and-demand balance — the “odds of selling”:
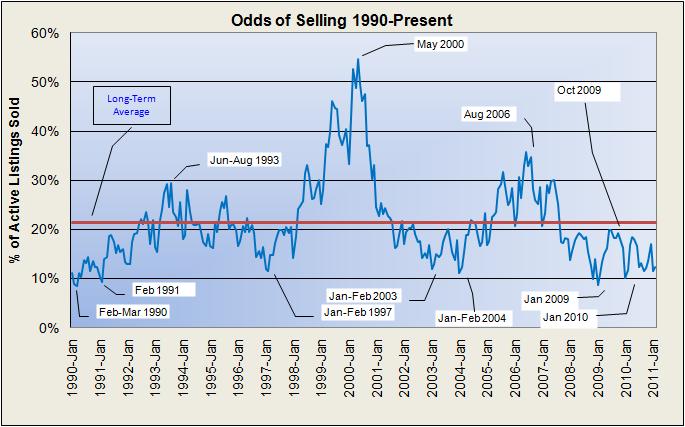
In the past — 1990-91, 1997, and 2003-04 — when we reached the point at which only about 10% of active listings sold in a month, it tended to signal an upturn. In the worst of those cycles, this metric bottomed twice before strong market recovery took hold. This cycle is very different, with the “odds of selling” dropping below 10% in January 2009 and again in January 2010, then moving very erratically over the past year around an average of about 15%. We might call this “bouncing along the bottom,” without a clear turning point so far.
Much of the difficulty is that our recovery depends so much on what happens in the rest of the country. We have seen impressive net in-migration and job growth in our area, but to the extent that those new Austinites have homes elsewhere that they can’t sell, or damaged credit because of the more extreme difficulties in California, Arizona, Nevada, and Florida (and a few other hard-hit states), they cannot become homeowners here. That is translating into increasing demand for local rental space, but it does hold home sales below what our population growth would otherwise indicate.
Based on all the economic news and forecasts that I study daily, and on my own experience in my own local real estate practice, I continue to believe that 2011 will be a transitional year, setting the stage for a new growth cycle in 2012. This is a very different market cycle than any other over the past 20-plus years, however, so I’ll keep watching and analyzing, and I will keep you informed at BillMorrisRealtor.com and with monthly updates of this Austin Market Dashboard.
Feel free to call or text or email me if you have questions about Central Texas real estate or if I can help you or family and friends with Austin-area real estate needs. It is always a pleasure to offer the benefits of my experience and market knowledge in helping clients buy or sell their homes, and I hope that if you’re not already in my client family you will join soon.

Good Article
Posted by Buy Online | April 18, 2011, 6:36 PMThank you. I appreciate you reading, and I hope you’ll subscribe to see future posts.
Posted by billmorrisrealtor | April 18, 2011, 7:59 PMGood Article
http://www.makesnowcitysa.co.cc
Posted by Buy Online | May 8, 2011, 3:51 AMGood Article
http://www.worksa-makes.co.cc
Posted by Buy Online | May 9, 2011, 12:58 AM[url=http://www.progresanowmake.us.tf]buy online[/url]
Posted by Buy Online | May 14, 2011, 1:36 PM