Yesterday I wrote about the Austin/Central Texas markets for new homes and for existing homes:
Austin/Central Texas Market Status — Existing Homes
I commented about the general health of the Austin Metro real estate market, with an average of just 70 days on the market.
That average statistic hides huge variation, and Days On Market is just one measure of market velocity:
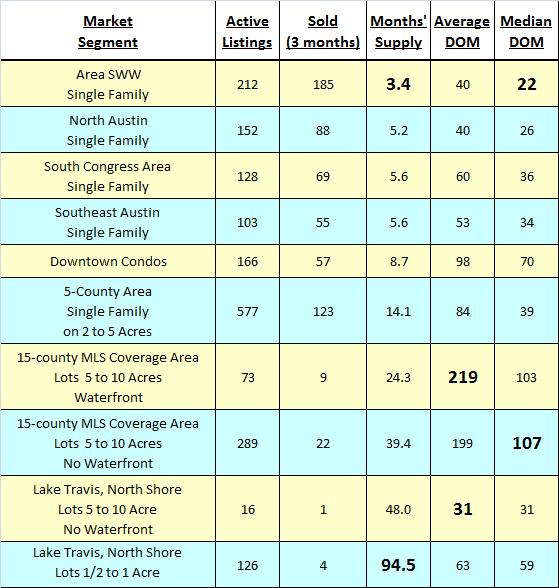
When lot/land listings are added, the variation is even more extreme: from 31 days to 219 days on market.
As an even more dramatic depiction of the variations of market health in this small sample of segments within the Austin/Central Texas real estate market, consider the supply/demand picture. At one end of the market, we have an important part of the Southwest Austin market (Area SWW) where existing inventory represents a 3.5 month supply — decidedly a seller’s market.
As I have pointed out before it is interesting, and sometimes even instructive, to compare market averages nationally and within regions, states, and metro areas. However, averages always obscure important details.
The data in the table above is a very small sample, and just one way to slice the Austin-area market. There are probably even more extreme examples of fast-moving and horribly over-supplied market segments, but I have included some where I have been working lately. The important point is: When you read about the health of a local or regional real estate market, do not assume that all properties compete in the same market conditions. This kind of market knowledge and market analysis is an important reason — whether you’re buying or selling — to have an experienced real estate professional representing your interests in any property transaction.

Discussion
No comments yet.