In 2025 Resale Results I discussed resale home prices during the past ten years, with a focus on the frantic market environment we experienced in 2022 and 2023. In this post I’ll add a look at home builders’ participation during that time, and the changing market conditions before and after.
First, the blue line in the chart below shows that new home construction represented a fairly steady 3,000 units for sale in 2016 through 2019, dipped significantly in 2020 through early 2022, then rebounded to just under 4,000 units listed from mid-2022 through 2025. The orange line in that chart shows the path of resale inventory during this 10-year period.
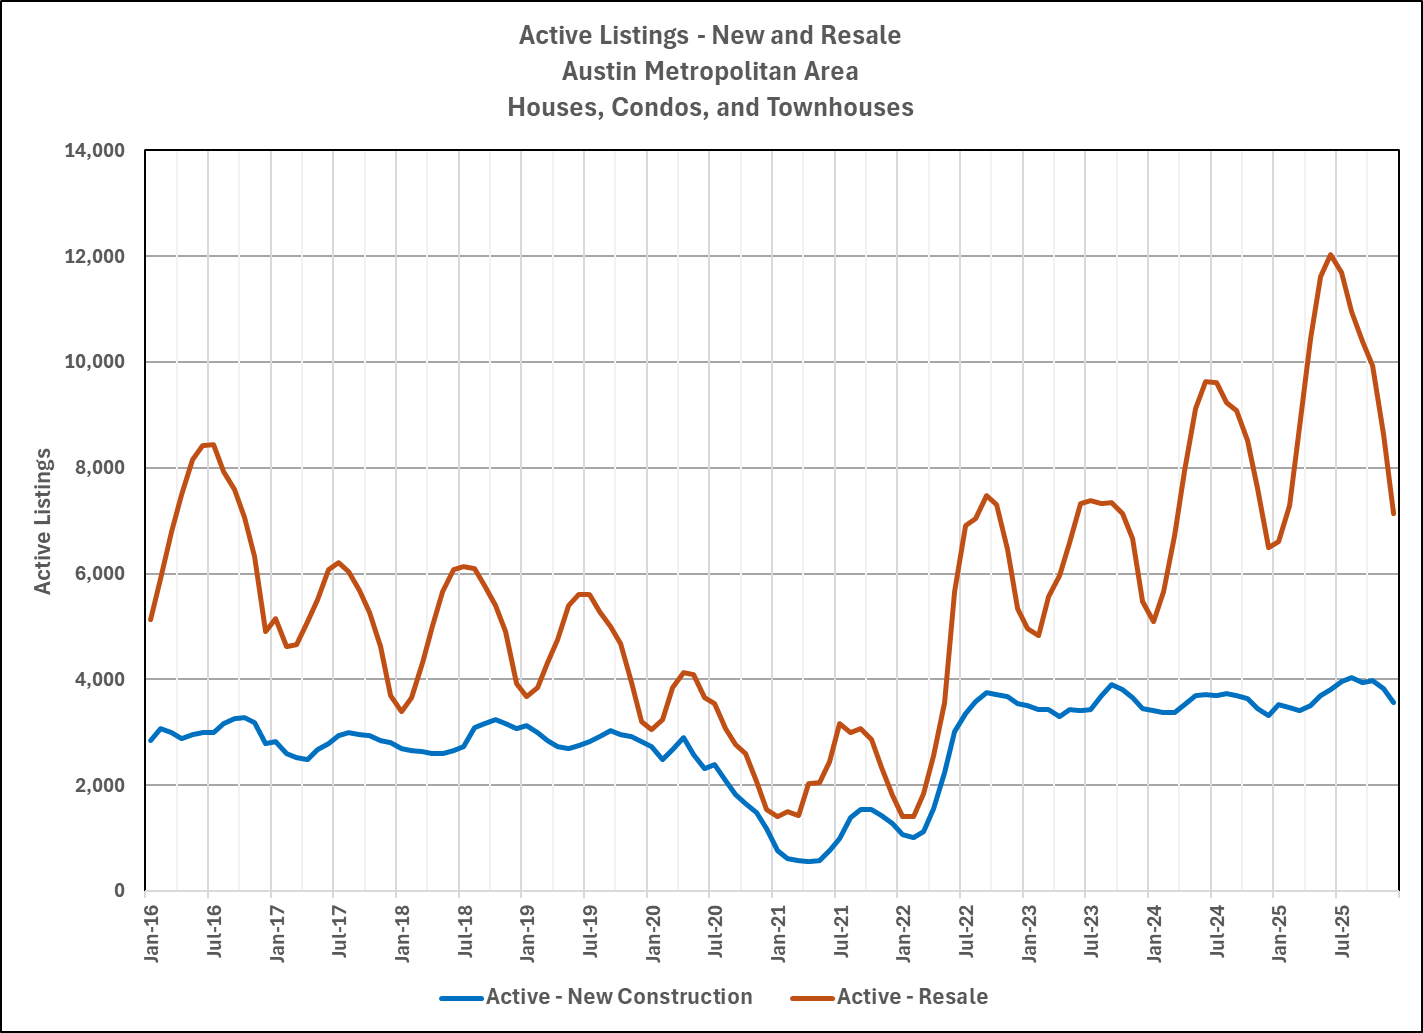
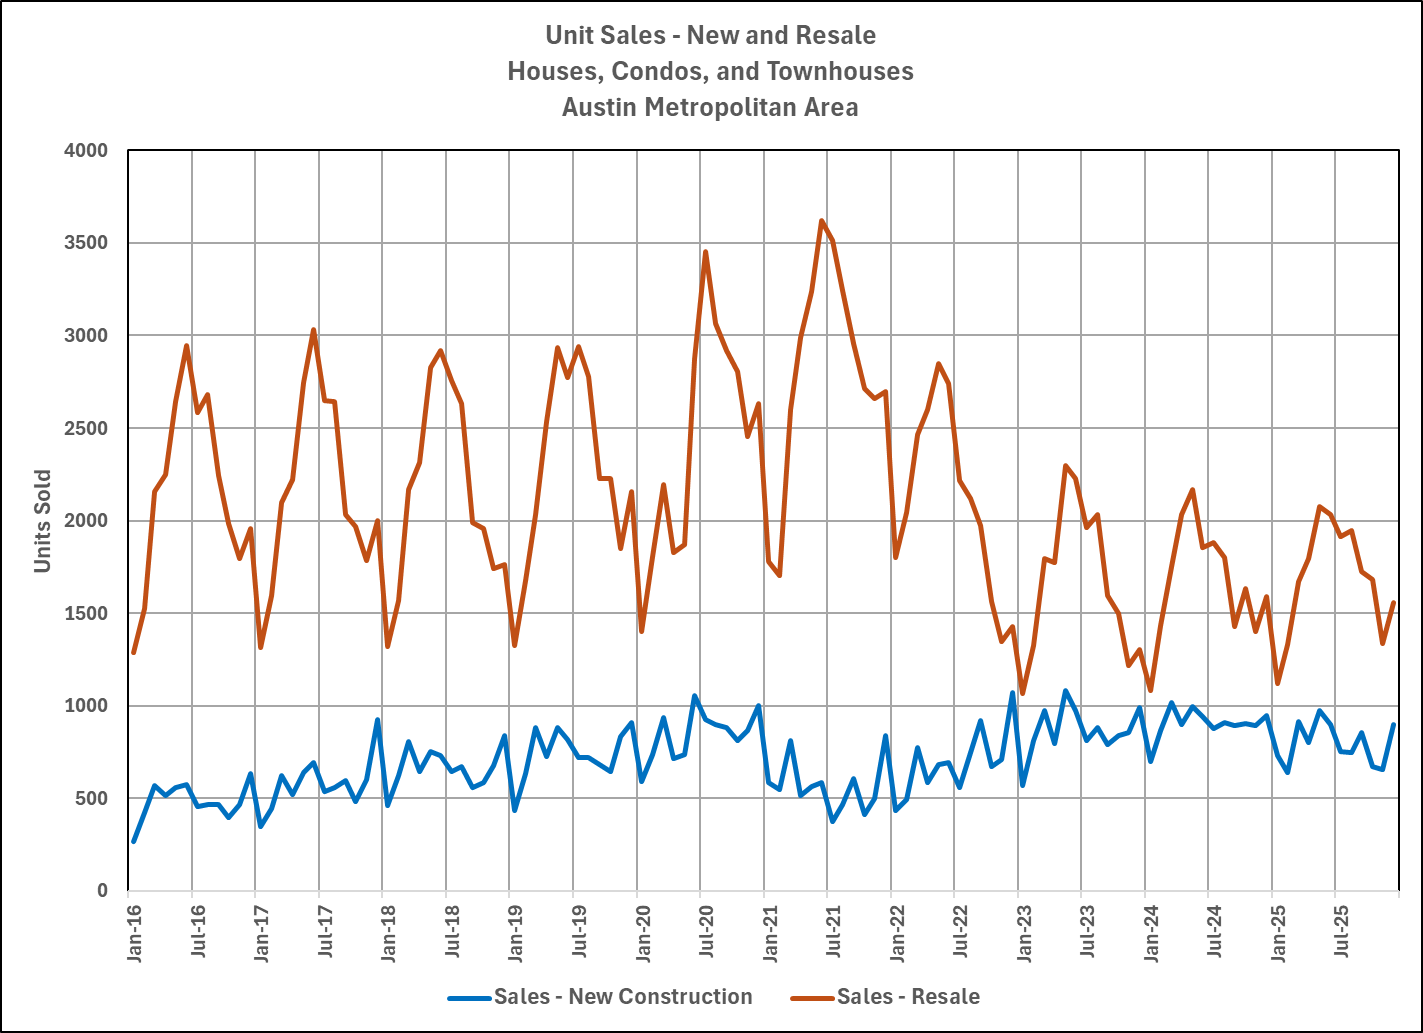
In the previous post I also discussed how resale listing inventory soared in 2022 through 2025, while sales of existing homes fell and flattened in those years. This chart adds data about home builders’ listing inventory (blue line), which stayed relatively stable as resale inventory declined:
Now, I want to show one other aspect of the market during that time — the proportion of total home sales and listings represented by newly built homes in recent years:

In that chart you can see that the percentage of all listings for new homes trended downward after the peak in January 2022, while resale inventory also declined. The meaningful change shown in that chart is the percentage of total sales contributed by home builders. From 2016 through 2020, the percentage of sales that were newly built homes averaged 23%. During 2021 and 2022, that contribution dipped to a little over 21%. But from 2023 through 2025, new homes represented an average of 34% of all sales.
It is worth noting that home builders don’t necessarily advertise every home they construct in the MLS system, so that last chart probably understates their contribution to total sales. It is also worth recalling builders’ experiences during the pandemic, beginning in early 2020, when travel bans and mask mandates virtually stopped work for months. Then construction materials markets were disrupted by dramatic changes in costs and availability. That market complication improved in the second half of 2022, and increasing builder sales in the following years reflect that change.
In 2022, though, as resale prices were “correcting” (see the first chart in 2025 Resale Results), builders became more aggressive in their pricing and countering the sharp increase in mortgage interest rates, and they capitalized during the years when other home sellers struggled.
The strong price growth through the first ten years of this long market cycle (2013 through 2022) created a LOT of home equity for home owners across the region, insulating us from another downturn like we experienced in 2008. Now, however, prices have returned to 2021 levels, and home owners who purchased in the past five years may well have too little equity to sell profitably, and if they do their next mortgage loans will be at much higher interest rates than their current liens.
I have watched for an upward trend in prices in recent years, and I haven’t seen any consistent signs. In part, that’s because of the equity-and-interest rate issue mentioned above. Builders’ aggressive positioning is also important. Some market watchers predict new strength in 2026. I’ll update as soon as I can confidently join that outlook.

Discussion
No comments yet.