Housing affordability is a frequent topic of conversation since the pandemic era and the changes in home prices and mortgage interest rates that followed. Because of our experience in Central Texas with the boom time in 2021 and 2022, it’s easy to believe that we’re in the only place that is now suffering with affordability issues. I trust the information in this post will correct that impression.
The Texas Real Estate Research Center at Texas A&M University provides a wealth of valuable information about all kinds of real estate across the state, including the Texas Housing Affordability Index (THAI). This measures the ability of a household earning the median family income to qualify to purchase the median-priced home. The Center’s definition: “The index is the ratio of median family income to the required income to qualify for a purchase mortgage loan at the current interest rate. A ratio of 1.00 means the median family income is exactly equal to the required income to purchase the median-priced home in the area. Affordability increases as the required qualifying income decreases relative to the median family income.”
The chart below shows the indices for the Austin metropolitan area and for the state of Texas, assuming that the buyer can commit no more than 35% of family income for housing:
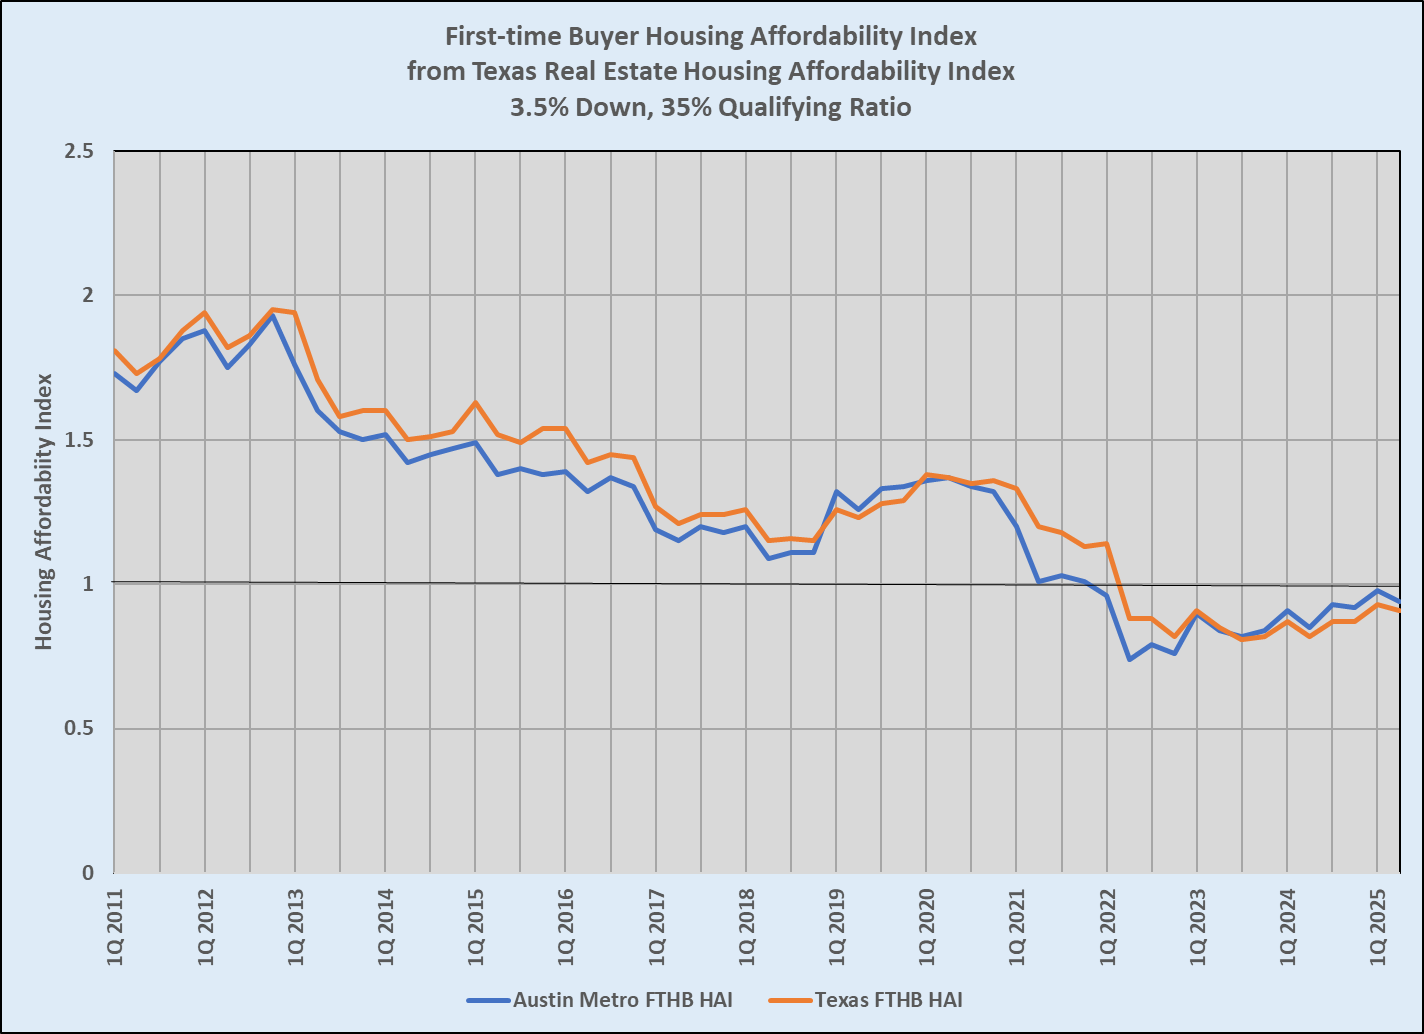
The buyers in that chart are fairly typical FHA borrowers, with a minimum down payment and a large commitment of income to a mortgage payment. Affordability is very different now than it was in 2013, at the beginning of the current market cycle. The index has been below 1.00 since the beginning of 2022. That means that a median income earner in Austin or in Texas would not qualify to purchase a median-priced home.
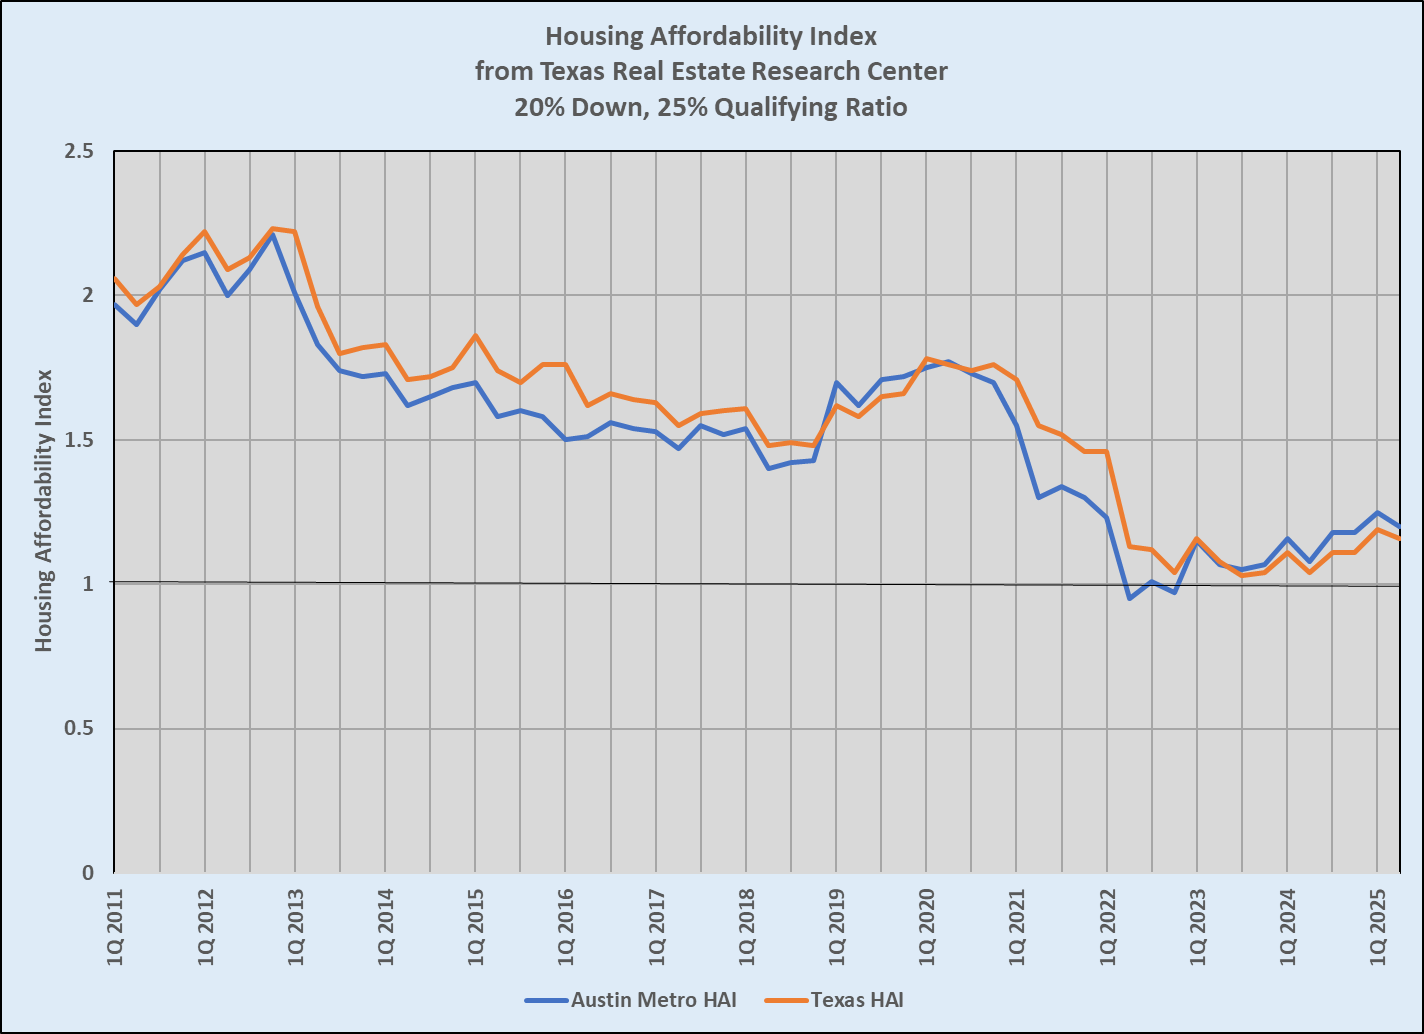
The following chart assumes a higher down payment and a smaller commitment for a mortgage payment, and you can see that from mid-2022 forward, the indices for Austin and for Texas are above 1.
For comparison, this view of the U.S. Fixed Housing Affordability Index covers only the past 4 1/2 years, but you can see that the shape of the curve in 2021 and 2022 looks much like the charts of Austin-area and Texas affordability shown above.

This index compares median income to the capacity to buy a median-priced home, just as the Texas HAI does, and is a composite of all fixed-rate mortgage loans. The graph is labeled differently, showing a match between income and housing cost at 100.00. Notice that the national index is essentially flat from mid-2023 through mid-2025, while the Austin and Texas indices have gained ground during that time.
Housing affordability is critically important, not only to the real estate industry but to the financial health and growth of the entire U.S. economy because home ownership is the predictable source of inter-generational wealth. It is unmatched by other investment vehicles and shelters homeowners from rising rent costs that restrict the financial freedom of non-homeowners.
Local planners across the United States are working to control and reduce the cost of housing. Reducing allowable lot sizes and allowing more and different kinds of residential structures are important tools in this work. Incentives for home builders and developers to include more affordable housing in their plans can make a real difference. This and other tools will be the subject of another post here, but Austinites should know that we’re not in this work alone. It is a nationwide effort.

Discussion
No comments yet.