As you have seen in my posts during 2025, this has been an unsettled market environment. It continues to be so. A view of the market that I have not provided yet this year is the distribution of home sales across various price ranges. This chart shows how our price distribution has changed since 2011, up through 2024:
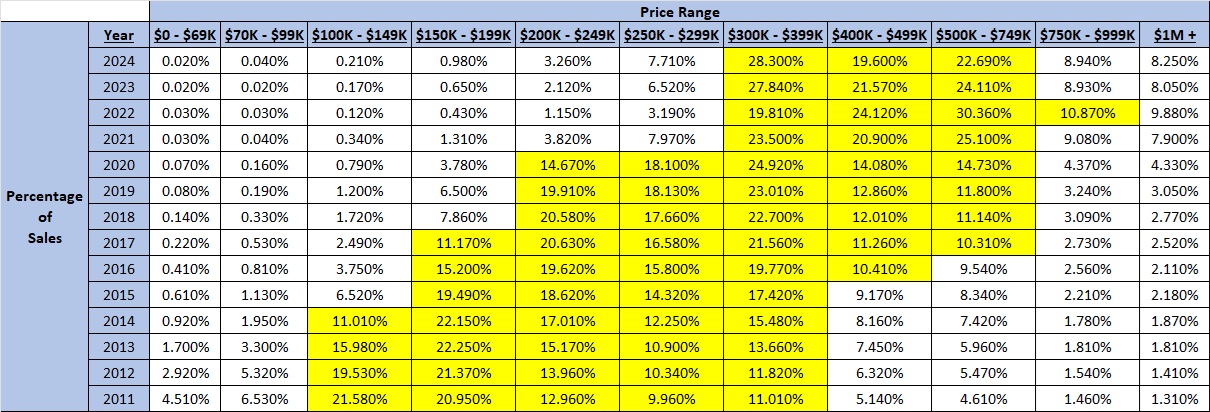
I have highlighted the price ranges each year in which 10% or more of all home sales occurred.
In 2011, those prevalent price ranges ran from $100,000 to $399,999, with almost 1/3 of total sales below $150,000!
In 2024, the 10%-plus ranges were from $300,000 to $749,999, with less than 1% of sales below $150,000. 70% of all sales that year were between $300,000 and $749,999, with a total of almost 40% above $500,000!
As I have noted in many posts in recent years, 2022 was an anomaly, seen in the chart above with more than 85% of sales occurring in the highlighted ranges, between $250,000 and $999,999. In that one year, more than 20% of all sales were priced above $750,000. The percentage of sales above $750,000 were lower in 2023 and 2024, but still represented 17% of all sales — almost 1 of every 5 sales!
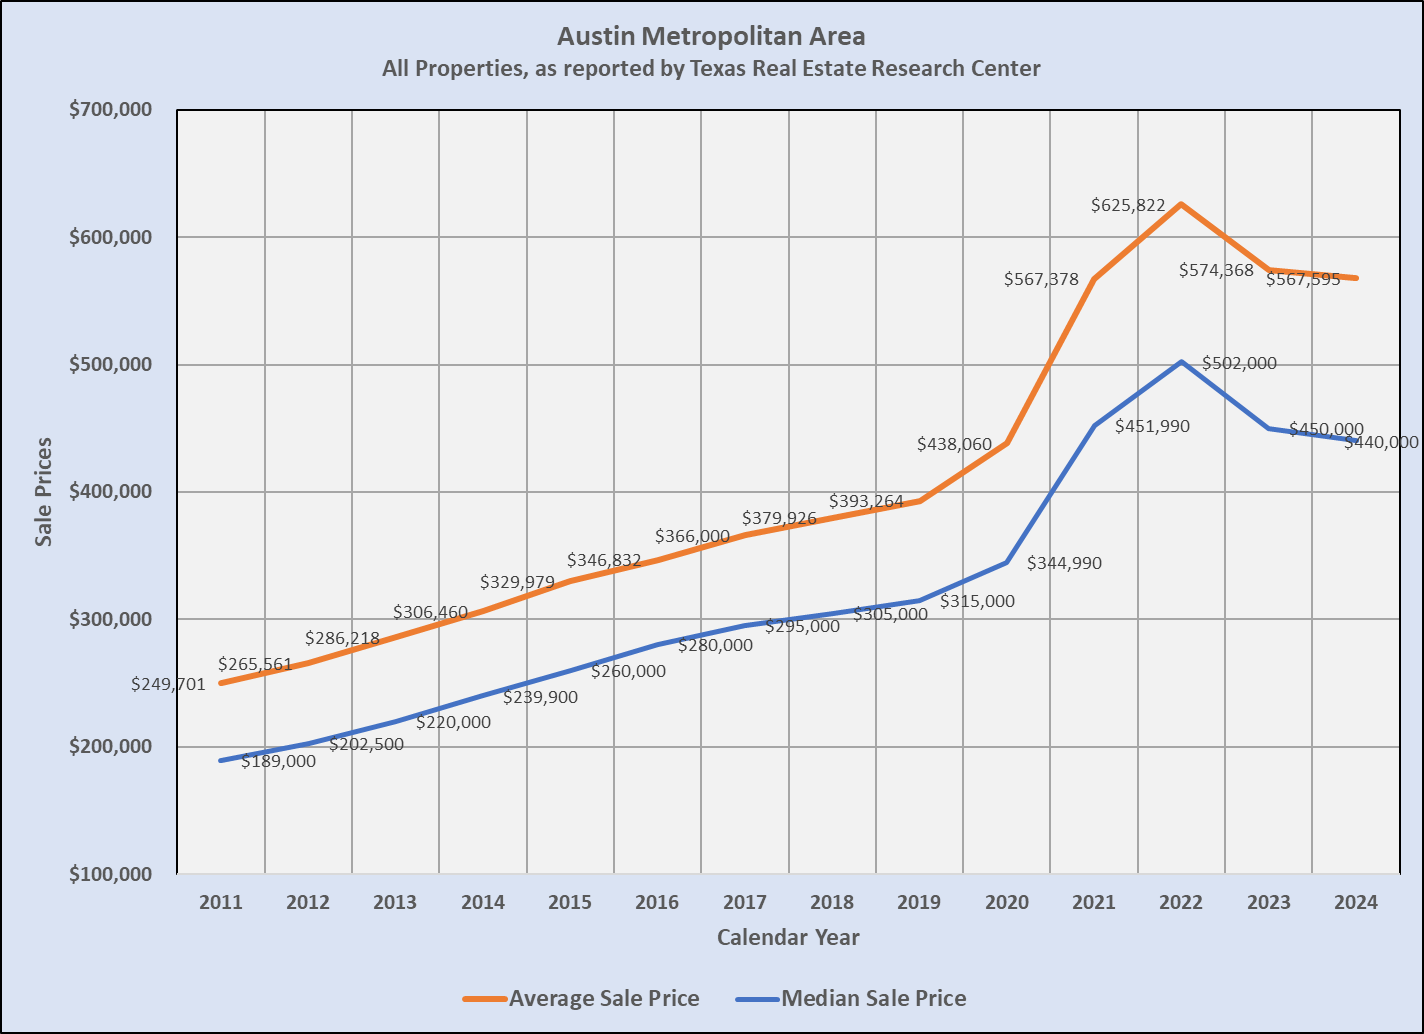
This chart of average and median sale prices emphasizes how dramatic that time of price escalation was:
And this look at the year-over-year changes in average and median prices helps to explain the market environment we are experiencing in 2025:
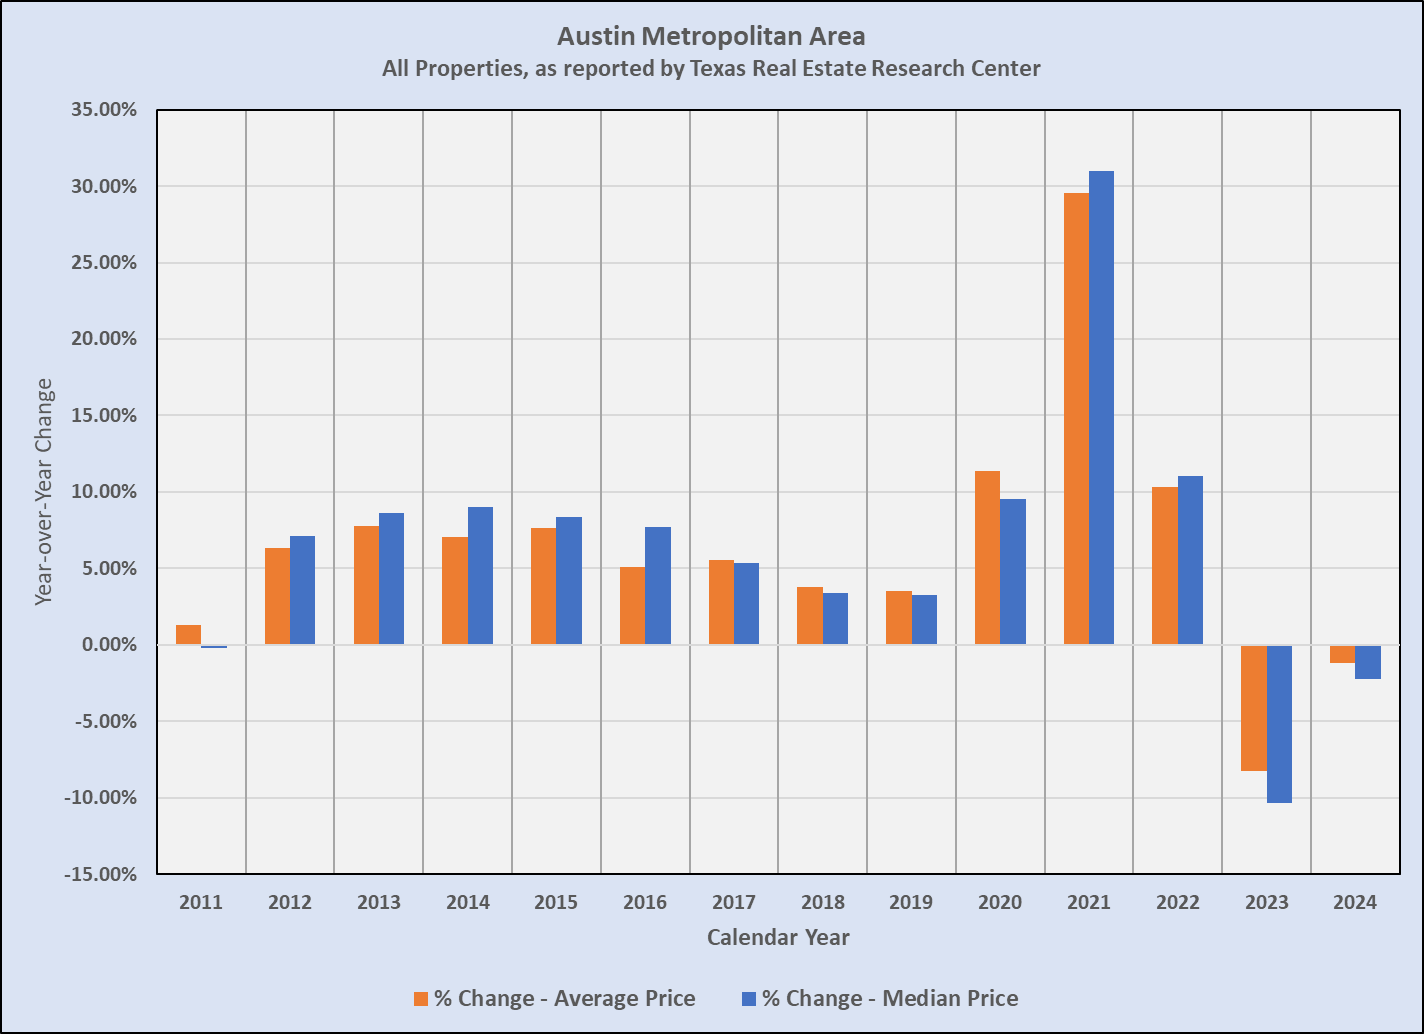
The pace of price growth noticeably increased in 2020, during the first months of the Covid pandemic, with average prices up more than 10% compared to 2019, but 2021 was up another 30%, followed by another 10% in 2022. Cumulatively, average and median prices increased almost 60% in those years.
In both of those graphs, it is clear that market prices have not recovered from that time. The average price in 2024 was still 10% below the 2022 peak, and the median was down 14%. Austin Market Dashboard — “if-fy” 2025 included a price chart showing that after some modest price growth early this year, the average price in July 2025 was at its lowest since March, and 19% below its peak in May 2022. The median sale price in July 2025 was down a shocking 28% compared to its peak in March and April 2022!
Still, the average price in July 2025 compared to July 2020 was up 55% and the median was up 41%. Over the same time span, we have seen mortgage interest rates move from below 3% in 2021 to rates now between 6.5% and 7%. Even with enormous growth in housing inventory those factors hamper buyer demand, with the disappointing sales result we see this year.

Discussion
Trackbacks/Pingbacks
Pingback: Austin Real Estate 2025: Market Shift Explained | Bill Morris on Austin Real Estate - September 12, 2025