I have provided a number of updates on the Austin-area residential market over the past few months, but it has been longer than usual since I discussed the market dashboard that I have used for guidance for many years.
Just to start, this long-term view is helpful to contrast today’s market environment across 35 years of history:

First, look at the orange line — the number of Active listings each month since January 1990. If you were watching the market in 2006, you’ll remember the fast-pace of home sales then, aided by sub-prime mortgages that led to the near-collapse of the lending industry and the “Great Recession” in 2007-2010. At its 2010 peak, residential listing inventory in the Austin metropolitan area reached more than 13,000 properties for sale. Today, we have more than 14,500 homes for sale.
The dark blue line shows the number of homes sold each month, and you can see that sales slumped in 2007 and didn’t reach 2006 levels again until 2013 (the first year of our current market cycle). Sales have slumped again in this cycle, compared to the peak in 2021. I added the 12-month moving average so it’s easier to see that annualized pricing has stayed soft over the past three years.
Finally, the green dotted line is an important metric in our industry — Months’ Supply — how long existing inventory will last if the current pace of sales continues. That market measure peaked at 7.4 in 2010. In May 2025, it reached 6 months — a level that we have traditionally considered “normal” or “balanced.” Obviously, that has not been true since 2012, but this market cycle has not been “normal” in any way.
Now, let’s focus on the period since 2012, when the market began to emerge from the last downturn:
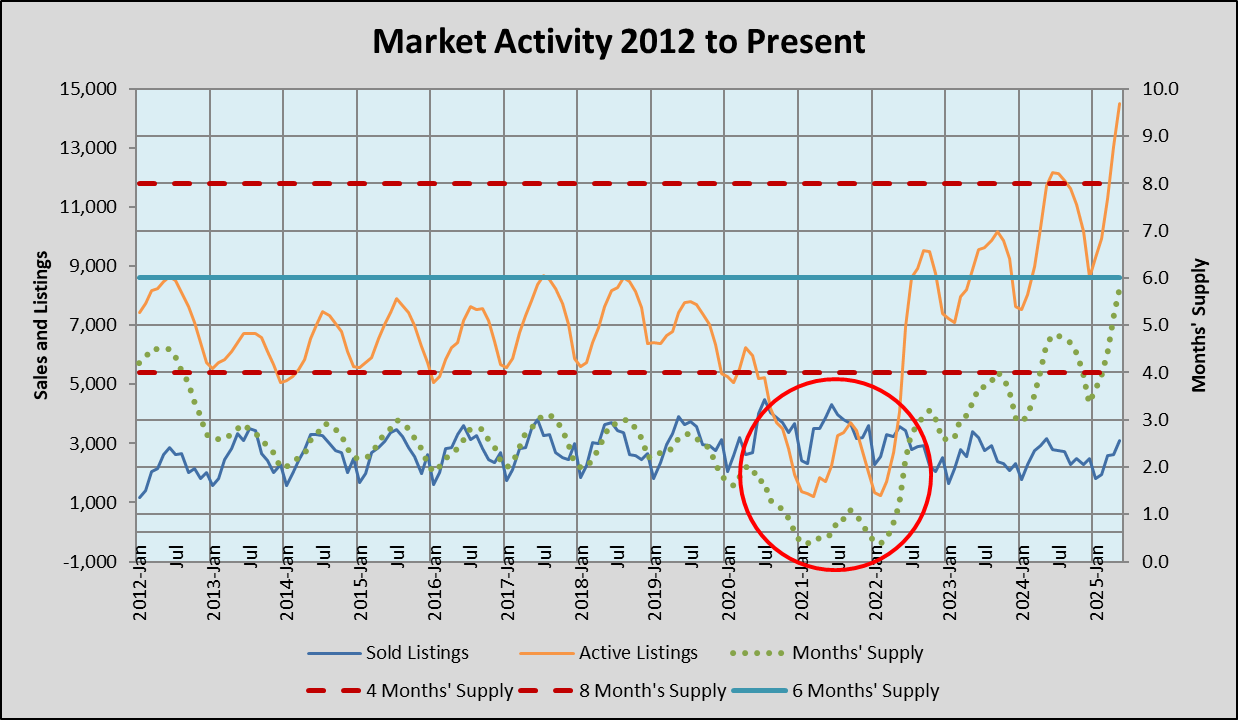
In that chart, the period from September 2020 through April 2022 are circled because we sold more homes than we listed each month. That has never happened before in the 35 years shown in the first chart in this post.
This chart emphasizes the magnitude of that first-of-a-kind situation:

That supply-and-demand imbalance created enormous upward pressure on home prices:
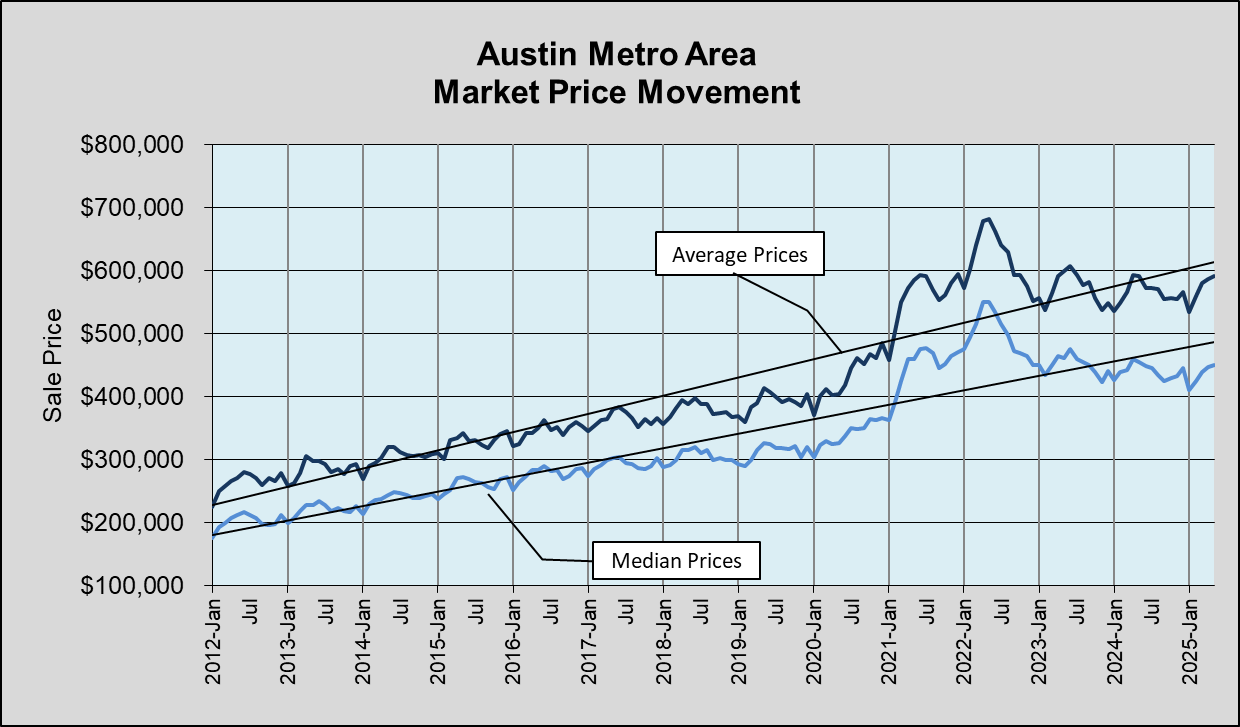
Notice that although we have seen an upward trend for home prices in 2025, both the median and average prices in May 2025 remain lower than the same time in 2024 and 2023, and far below May 2022. (The median price is even lower than May 2021!)
So, listing inventory is up and sales are down on a seasonal basis. Sales prices are struggling to make gains over recent years. There are buyers in the market and homes are selling, but memories of downturns in 2006-2007 and 2021-2022, much higher mortgage interest rates than just a couple of years ago, and uncertainties about the broader economy create doubts. Many buyers are more tentative than we would expect with the current level of inventory.
Watching the strength of the financial markets, low inflation, and low unemployment, we may well see new momentum during the summer months. Will we transition soon into a new market cycle that behaves more like pre-pandemic cycles did? There is no clear evidence of momentum yet, but I’ll keep watching and keep you informed here.

Discussion
Trackbacks/Pingbacks
Pingback: Austin Market Dashboard — “if-fy” 2025 | Bill Morris on Austin Real Estate - August 28, 2025