I continue to expect more positive market conditions in 2025 than we saw last year. We have not seen a meaningful turn in that direction yet, however, and disruptions in the larger economy may delay that move.
A critical reason for growth in our market environment is continued demand for housing in the Austin metropolitan area:
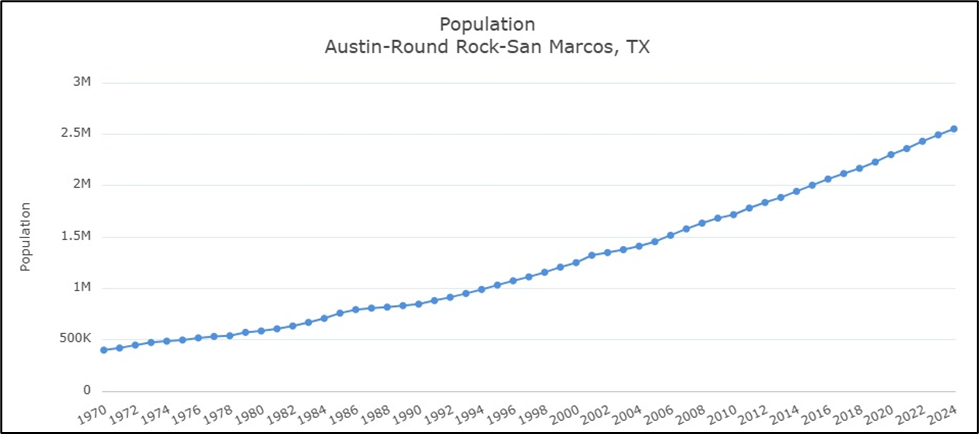
Some reports indicate that population growth slowed somewhat in 2024, but that is not visible in the graph above.
The Austin metropolian area had a shortage in housing of all kinds before we entered the current market cycle in 2013, and new construction lagged in 2013 and 2014, leaving us further behind than before. The population of the metro area in 2013 was a little under 1.9 million. In 2024 the population was little above 2.5 million, an increase of more than 650,000 residents.
Compare that to this summary of building permits approved over the past 10 years:
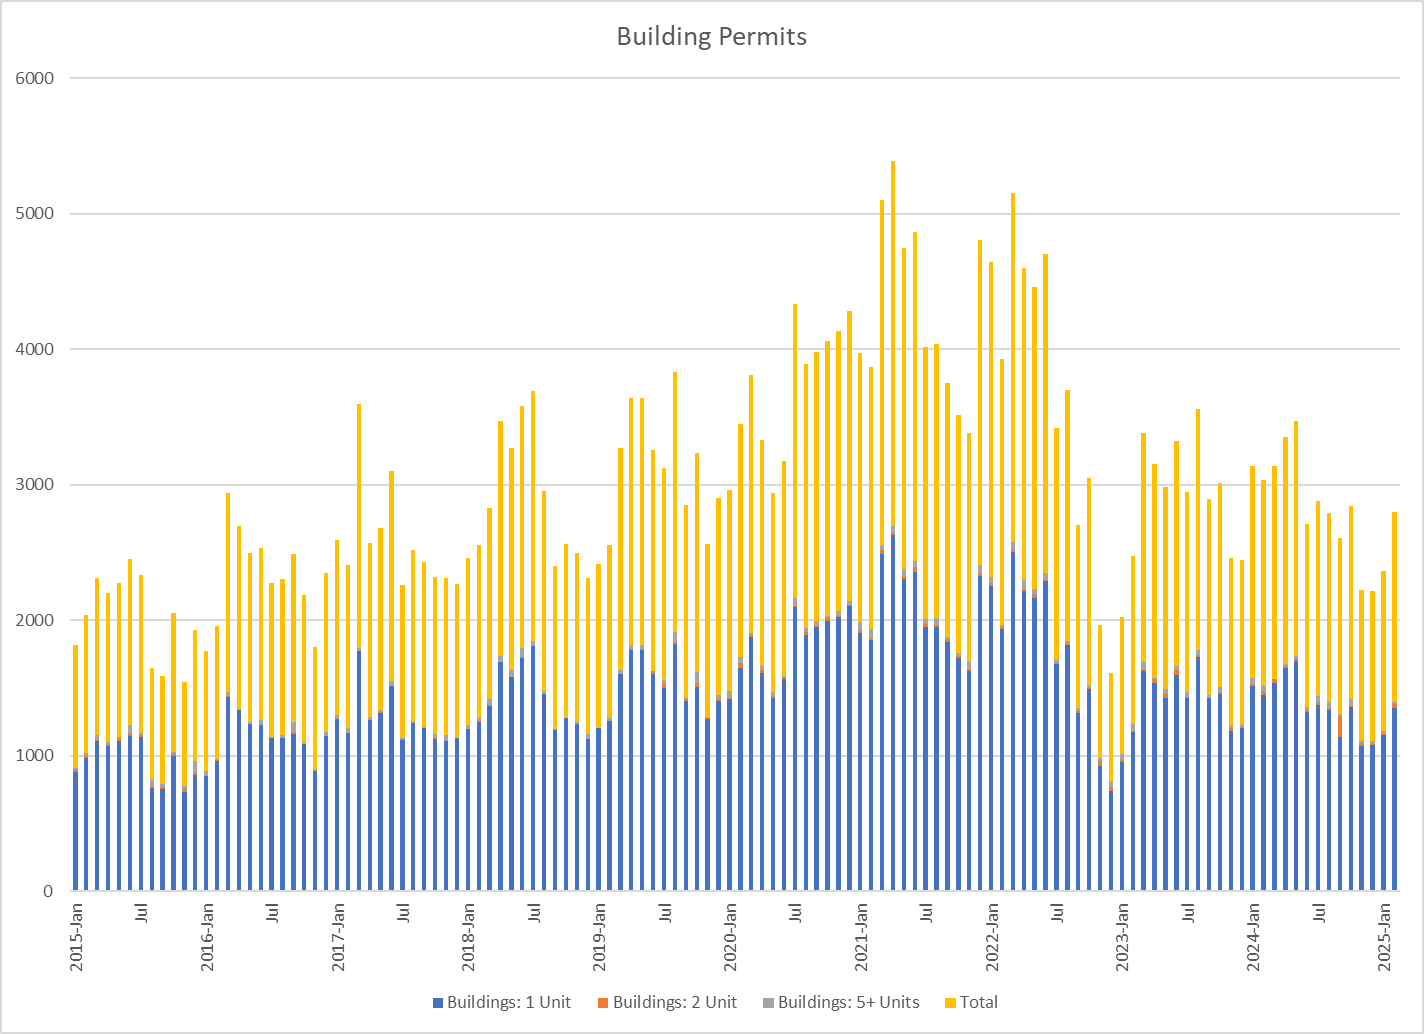
Clearly, many new Austinites came with families, so the supply of housing did not need to increase to absorb every one of the new residents individually, but you can see that we have not permitted enough new dwelling units to match population growth in any case, despite home builders attempting to keep pace in 2020, 2021, and early 2022.
I have written many times about the unprecedented market activity in 2021, 2022, and 2023, and I have discussed the soft and unpredictable environment we experienced in 2024.
Countering the extreme supply-and-demand imbalance is general economic uncertainty and mortgage interest rates at about twice their level during the pandemic years. We still see inflated “original list prices” on new listings, and price reductions on the way to successful sales. Many would-be home sellers are staying out of the market, and the quality of much resale inventory is lacking relative to list prices.
This chart summarizes the resulting market conditions as of the end of February 2025:
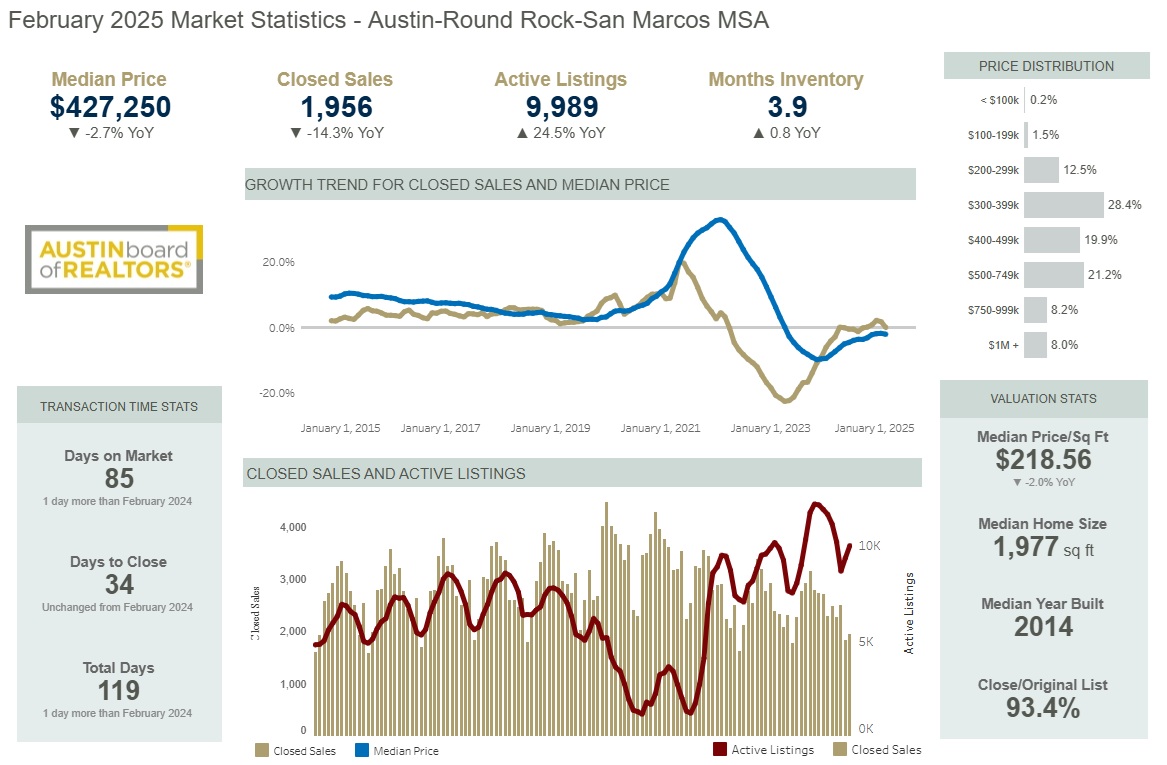
Across the top of that image you can see that the median sale price across the 5-county Austin metropolitan area was down in February compared to one year earlier, and that the number of closed sales was down 14.3% year-over-year, even with 24.5% more listing inventory.
The graph in the center of that image shows that the number of closed sales in February 2025 was lower than the number closed in February 2015! The blue line in that chart clearly shows the 2022 peak of sales prices, and the rapid decline that followed. The median sale price in February was the lowest we have seen in the 10 years shown.
The bottom graph in that image shows the number of closed sales (yellow) compared to the number of active listings (maroon). And to the right of that graph, notice that the ratio of close (sold) price to original list price last month was 93.4%. That ratio was routinely 100% or higher during the 2021-2023 boom.
Broad economic and political uncertainties and concerns certainly are holding back many would-be home buyers, many of whom spent years building the expectation that mortgage rates were routinely 3.5% to 4.5%. In addition, lower prices and interest rates that are now typically 6.5% to 7% or higher are keeping many would-be home sellers out of the market — notably those who purchased their homes in 2000 – 2003 — and therefore delaying the next purchases that some might otherwise make.
Consensus forecasts have still been optimistic moving into 2025. As I write this, financial markets are in turmoil about international trade tariffs. We will all watch with interest to see how this settles, and I’ll keep you informed here about residential real estate.

Discussion
Trackbacks/Pingbacks
Pingback: Timing and Pricing: Key Insights for Austin Home Sellers | Bill Morris on Austin Real Estate - April 11, 2025